by Dingding Wang, Guannan Zhao, Yajie Hu, Neil F. Johnson, Brent E. Kinser and Mitsunori Ogihara
1. Introduction
With the advent of the Internet there have been a number of efforts to turn printed and hand-written documents into searchable digital texts, such as Google Books and HathiTrust. The digital text collections vary in the size, the focus (authors, period, area, language, etc.), the type of documents collected (poetry, essays, fictions, letters, receipts, etc.), the type of digital objects available (plain texts, encoded-texts, original images, maps, etc.), and the user access (open access, registered user-only, and paid subscription). Regardless of exactly what kind of collection it is, the availability of a large digital document collection raises the question (or the hope) of whether something new can be discovered through text mining, or, through what Franco Moretti has called “distant reading” (Ramsay). The work we present here is motivated by the question of whether or not such an analysis of a body of correspondent will decrease the gap between computational analysis and humanistic interpretation.
Because of their unique position as a semi-private form of life-writing, “distant reading” creates an interesting opportunity for analysis. To date, not that many collections of letters have been digitised. As seen in, for example, The Project Gutenberg,1 many of the digital text collections are literary works, but some fraction of the data are letters, such as the Charles Dickens letters and the Mark Twain letters that are included in The Project Gutenberg and the Stanford University’s Project, Mapping the Republic of Letters Project.2 Here we use the letters of Thomas Carlyle and his wife Jane Welsh as the subject.
Thomas Carlyle (1795-1881) and his wife Jane Baillie Welsh Carlyle (1801-1866) and The Carlyle Letters Online3 is the XML-encoded, online version of The Duke-Edinburgh Edition of The Collected Letters of Thomas and Jane Welsh Carlyle (Campbell, Christianson and Sorensen). The goal of this paper is to explore ways to study this particular collection of letters, by incorporating the biographical knowledge about the couple.
There are two general approaches to the distant reading-based study of a letter collection. The first approach is the text mining, in terms of specific characters that are present in individual letters, for example, the use of specific vocabulary and the sentiment analysis. The second one is the physics of communication. In a seminal paper, Barabási studied the distribution of intervals in human communications, in particular, the distribution of time intervals in successive letters. He showed that the distribution followed the “power law” using letters written by the biologist Charles Darwin and by the physicist Albert Einstein. This seminal work raises the question of whether this “power law” phenomenon is universal in written communications, and whether other measures will shed light on the “bursty” nature of human actions. Vásquez et al. present the use of two autocorrelation measures, the B (burstiness) and M (memory) to study the distribution of intervals. The B-M classification scheme can be naturally applied to a letter collection and its subsets.
Using these approaches, we ask the following questions:
- In terms of the B-M classification, where does the collection of the letters written by Thomas Carlyle (by Jane Welsh, or between Thomas and Jane Welsh) sit?
- Does the pattern of occurrences of a word over time offer information about the meaning of the word?
- Was the emotion expressed in the letters from Thomas to Jane Welsh constant throughout their life time?
In the next sections, we will present the methods we used and the results obtained.
The paper is organised as follows. Section 2 provides an overview of the Thomas Carlyle Letters Online. Section 3 presents the methods used for the aforementioned questions and the answers discovered. Section 4 concludes the paper with possible new directions.
2. Thomas Carlyle and His Letters
Thomas Carlyle (1795-1881) and his wife Jane Baillie Welsh Carlyle (1801-1866) were both prolific and remarkable writers of letters, which numbered in the thousands. By the middle of the nineteenth century, works such as Sartor Resartus (1833-34), The French Revolution (1837), Chartism (1839), On Heroes, Hero-Worship, and the Heroic in History (1841), and Past and Present (1843), all written in a bracingly idiosyncratic brand of Swiftian satire had helped to make Thomas (TC) a household name. According to the poet Elizabeth Barrett Browning, TC was “the Great Teacher of the Age.” For her part, Jane (JWC) served as an aptly brilliant counterpart to her husband’s ability and fame. Their circle included the brightest lights of Victorian literary, political, and religious society. Even a very partial list of their correspondents astonishes as it represents a who’s who of the era: Elizabeth Barrett Browning, Robert Browning, Charles Dickens, Charles Gavan Duffy, George Eliot, Ralph Waldo Emerson, John Forster, Margaret Fuller, Goethe, Alexander Herzen, Geraldine Jewsbury, Charles Kingsley, Guiseppe Mazzini, John Stuart Mill, John Ruskin, Alfred Tennyson, William Makepeace Thackeray, John Tyndall, and the list extends to all manner of aristocrats, politicians revolutionaries, authors, clergymen, members of Parliament, and family members. Their letters serve as a cultural treasure trove for an era, which makes them an ideal focal point for a study such as the one undertaken here.
3. Methods and Results
3.1. Data and its Preprocessing
The data files used for this research are the volumes 1 – 35 of the collection. All files are in the XML format. In the online collection these XML files are processed through CSS for user access. Individual letters are extracted from these files by computationally identifying labels specific to the beginning of letters and then removing editorial notes, salutation, and closing. The numbers of letters used for the research are shown below:
Table 1
| Type | Number |
| Between TC and JBW | 214 |
| Between TC and JWC | 875 |
| From JWC to others | 901 |
| From TC to others | 5,352 |
There was a small fraction (≈ 2.5%) of letters bearing incomplete date information (in most cases the day of month was missing). The missing day of the month is set to the first day and the missing month of year is set to January.
3.2. Time Intervals
The time interval analysis is conducted by first converting the letter collections to event sequences. There is no letter in the collection written earlier than the year 1813 or later than the year 1959. Given any “event” e, we check for each day between January 1, 1813 and December 31, 1859 to see whether the event occurred on that particular day. The event may occur more than once on a given day, but we only distinguish between nonoccurrence and occurrence and treat multiple occurrences on a day as a single occurrence. By representing the occurrence of the event by 1 and the nonoccurrence by 0 and then by concatenating the event occurrence bits in the calendar order, we generate a 0?1 sequence representing the occurrences of the events during the period covered in the letter collection.
After generating the daily event sequence we count the distance between every pair of successive events; that is, the distance between every pair of 1s that appear in the sequence with no 1 in between. For example, 0001010010110 has four pairs of events in succession and their distance values are: 2, 3, 2, 1. The distance values thus calculated can be viewed as samples from a discrete distribution P(n),n ≥ 1. The previous example generates the observation P(1) = 0.25,P(2) = 0.5,P(3) = 0.25, and P(m) = 0 for all m ≥ 4.
Given the distribution thus generated we question what mathematical model well approximates the observation. Barabási (6) shows that the human generated communications have a power-law interval distribution. A power-law distribution P(n),n ≥ 1, is one with tail distribution P(x ≥ n),n ≥ n0, and is equal to cn–α for some positive constants n0,c, and α. Because of the form cn–α, in the log-log plot the tail of a power-law distribution resembles a straight-line with a negative slope. In each of the plots the tail appears to be linear, and thus it confirms the observation by Barabási that the human generated communication follows power-law distributions.
Figure 1 shows the log-log plot of the interval distribution of the letter collection of volumes 3-6, which is a subset of the data. Here the distribution parameter, α, is estimated using an in-house multi-processor implementation of the celebrated power-law estimation code of Clauset,4 we test whether the observed interval value distribution is a power-law distribution.
Figure 1: The power-law plots of the letter written by TC in the volumes 3 – 6.
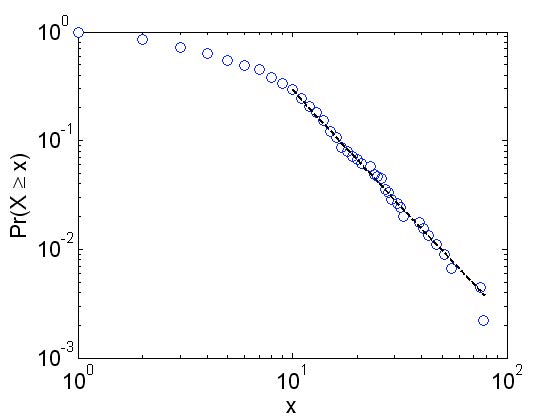
The estimated value of the parameter alpha is 3.07. Although this is an unusually high value for the inter-event time power-law in human activity, Zhao et al. recently found similar values (closer to 3.5) for waiting-time between price changes in the global currency markets.
Next we study the interval sequences in more detail. We use the B-M statistical analysis of Goh et al. Let r1,…,rN be a series of intervals occurring over time in this order. Let μ and σ be respectively the mean and the standard standard deviation of the r’s. Let μ1 and σ1 (respectively, μ2 and σ2) be the mean and the standard deviation calculated from the samples without rN (respectively, r1) Then we define B and M of the series as:
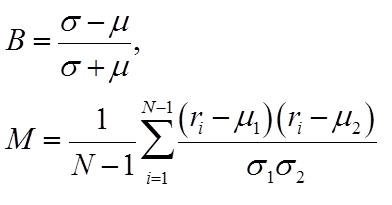
Both values range between -1 and +1. The two quantities, B and M, measure respectively the burstiness – the degree in which sudden jumps or dips occurs in a collection of numbers when viewed as a distribution – and the memory – the degree in which a value in a sequence is correlated with the value immediately preceding to it. Váquez et al. and Goh and Barabási study a number of interval sequences with respect to the B-M model. In these papers it is observed that human activities tend to have a high positive B value and a small M value and that natural phenomena tend to have a non-small M value and a small positive B value. To understand the potential implications of this B-M statistical analysis we note the following: If the series of 1’s and 0’s is truly drawn from a memory-less stochastic process using a constant probability of drawing a 1 – or equivalently, if the actual series is randomised through shuffling – then this sequence becomes indistinguishable from one drawn from a Poisson process. Hence the Burstiness B is essentially zero since the mean and standard deviation will become arbitrarily close to zero in the limit of a very long sequence. Likewise, the Memory M is essentially zero since the correlation between subsequent time-intervals will disappear in the limit of a very long sequence. By contrast, deviations from B = 0 and M = 0 indicate some kind of non-Poisson process at play – either through the burstiness of the distribution of time intervals or the memory. The burstiness B may be positive or negative according to whether the observation of long time intervals occurs more frequently, or less frequently, than that expected by chance. Likewise the memory M may be positive or negative according to whether a long time interval is followed by another long one, or a short one, more frequently than that expected by chance. In either case, these non-zero B and M values demand a mechanistic explanation as to their origin.
The table below presents the values:
Table 2
| Collection | M | B |
| All letters in the collection | .16346 | .08772 |
| JWC to others | –.02115 | .38848 |
| TC to others | .23312 | .06214 |
| Between TC and JWC | .10303 | .40124 |
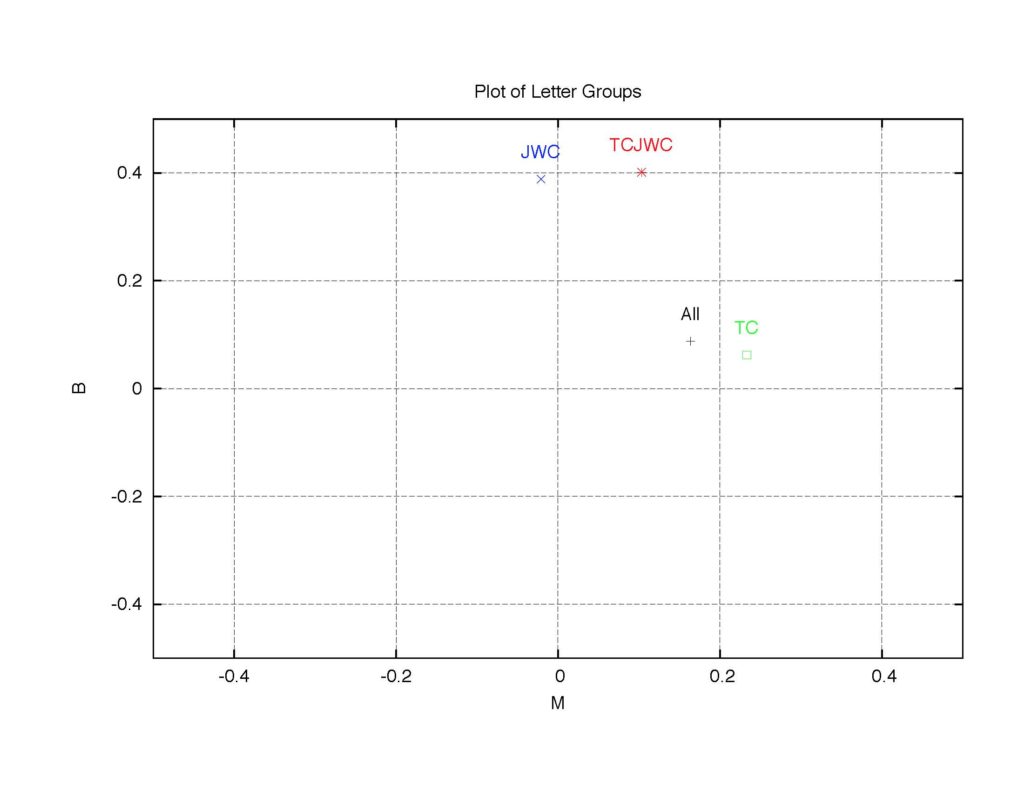
There is a sharp contrast between TC and JWC. While JWC has a high B value and a low M value, TC has a medium M value and a small B value. The difference between the values for the TC/JWC letters, other human activities, and natural phenomena can be illustrated in the plot below.
Figure 2: The B-M map of the letter collections.
“TCJWC”(*) is the letters between TC and JWC. “JWC” (×) and “TC” (?) are respectively the letters from JWC to the others and those from TC to the others. “All” (+) stands for all the letters.
Next we calculate the B-M map of each word appearing in the letters from TC to others. There are 9, 387 unique words (without stemming and with identification of upper-case words and lower-case words) in the collection. Note that with nearly ten thousand points of data, the whole collection of B-M maps appears almost symmetric around the vertical axis.
Figure 3: The B-M map of all 10, 000- words.
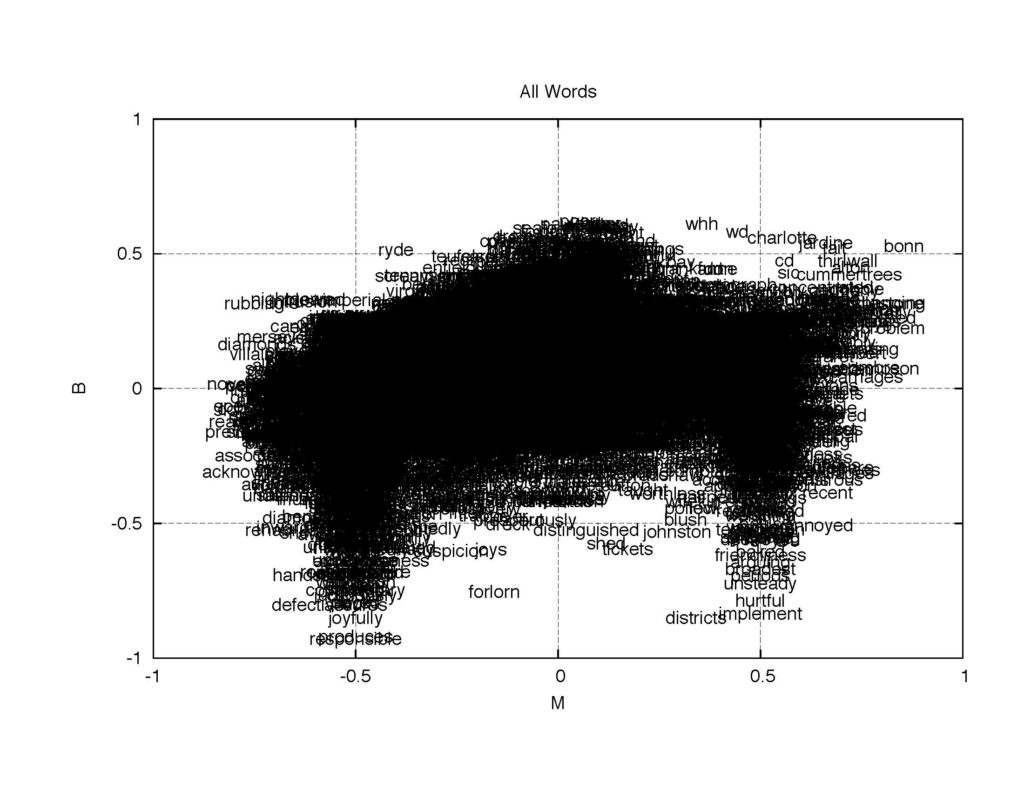
How are the points clustered in this large map? We rank the words in the decreasing order of the total number of occurrences (again, if there are multiple letters written on a day, occurrence in one of the multiple letters is sufficient to treat it as an event). The figure below shows that high frequency words appear close to the vertical-axis and close to the top of the map.
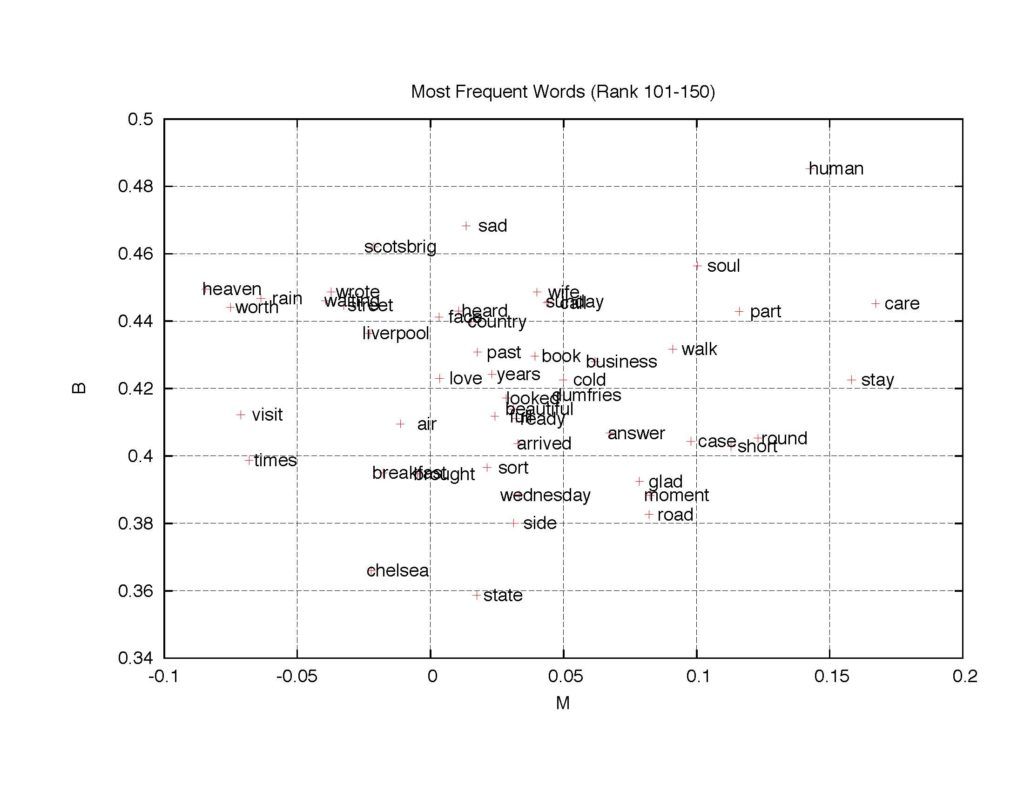
Figure 4: The B-M map of 150 most frequent words. Words ranked 1-50, 51-100, and 101-150.
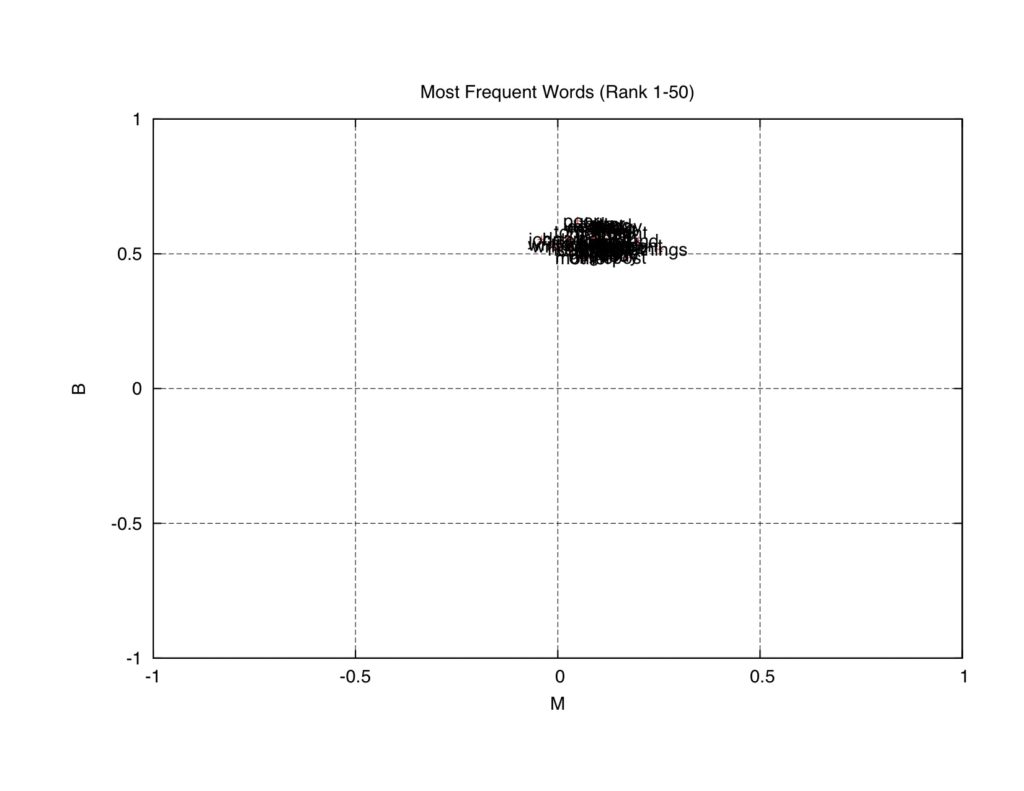
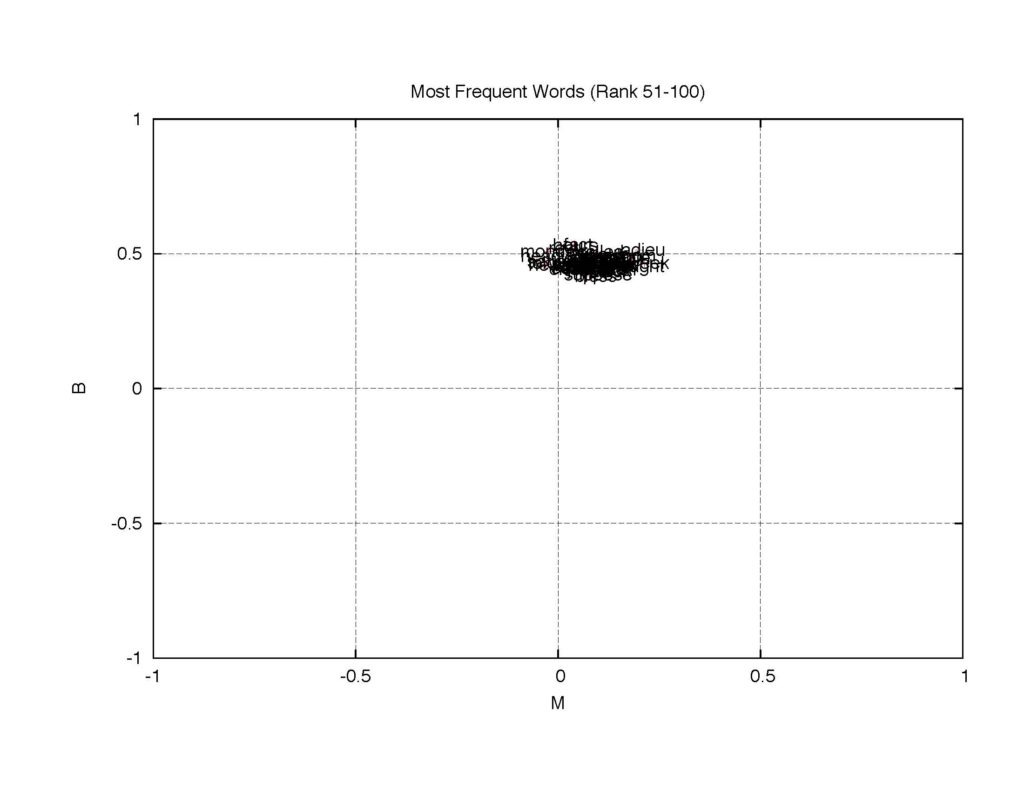
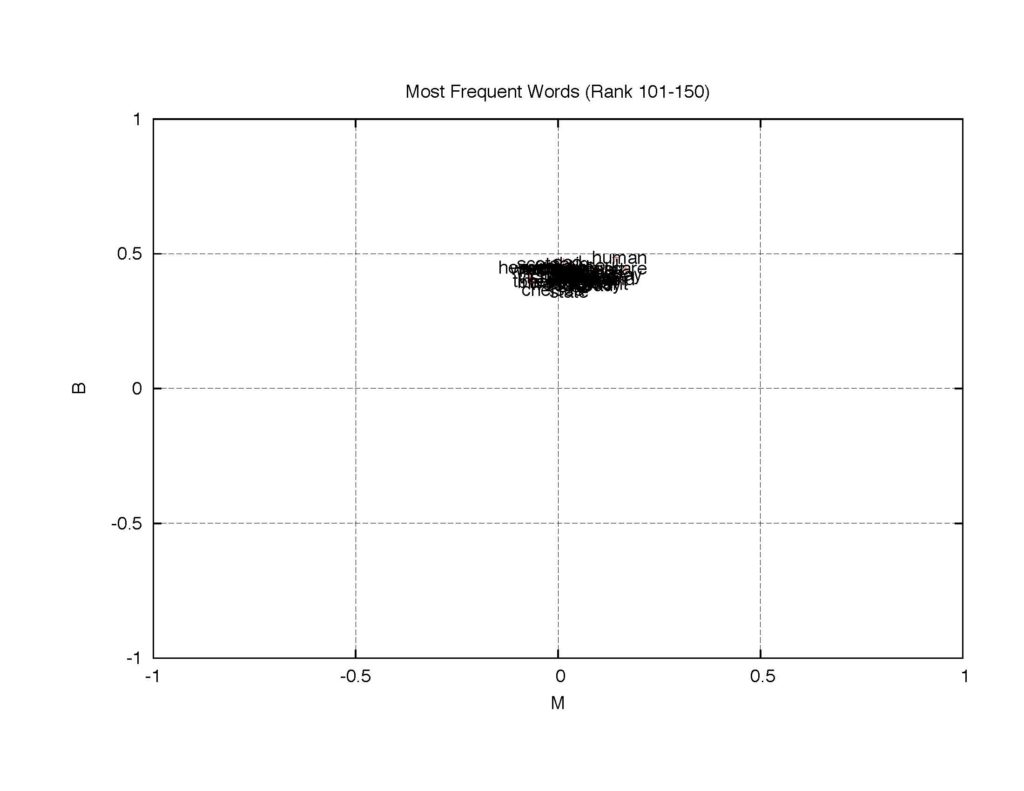
Figure 5: The B-M map of 50 most frequent words (magnified).
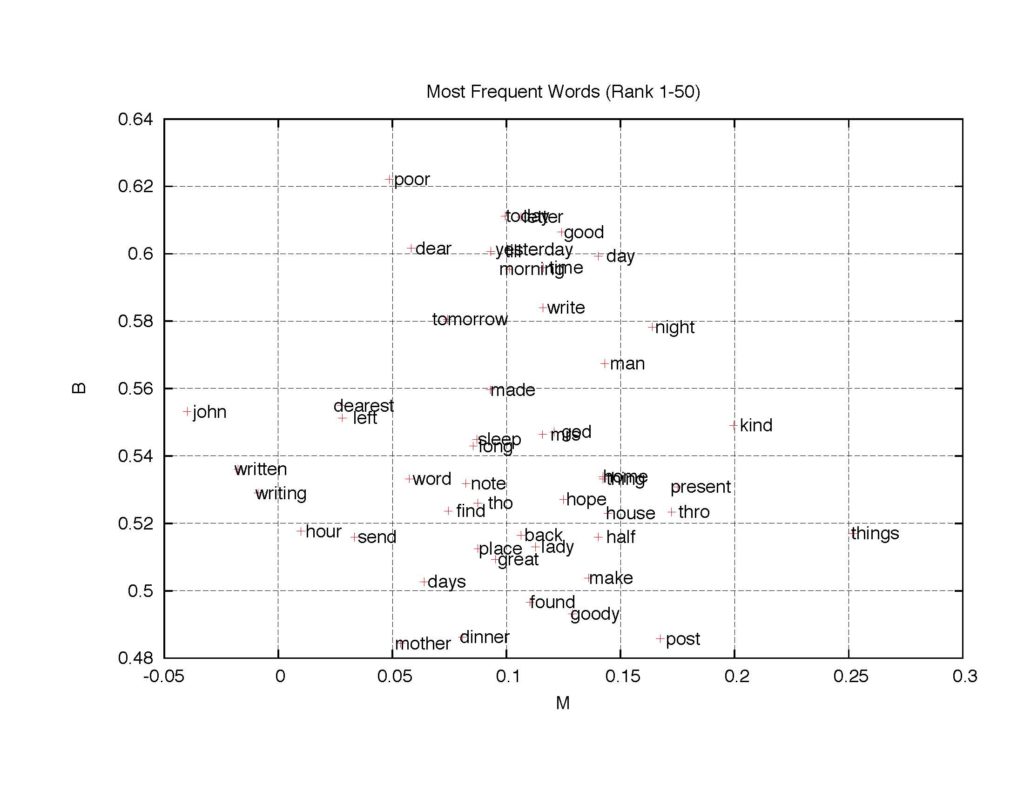
Figure 6: The B-M map of the next 50 most frequent words (magnified).
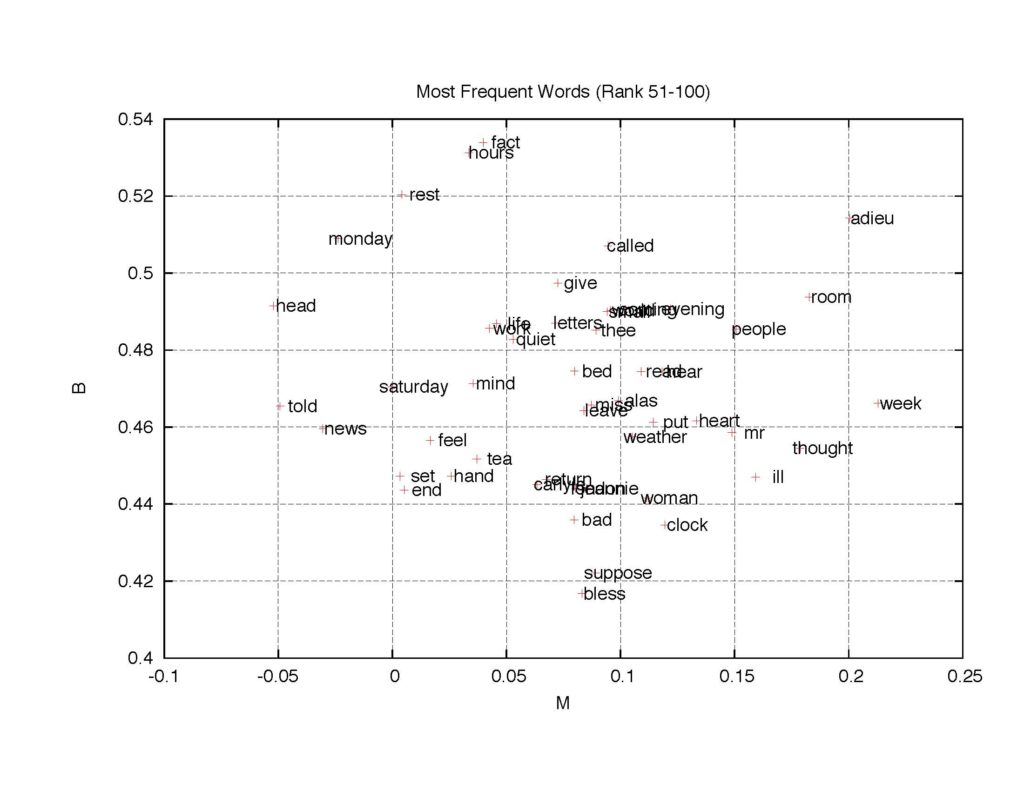
Figure 7: The B-M map of the next 50 most frequent words (magnified).
3.3. Word Concentration Analysis
We look at the frequency of an individual word in more detail. There are words that appear in the TC letters for a certain period of time and we question whether it is possible to quantify how the words are concentrated. To quantify the concentration we use a bit sequence similar to the previous one. The difference here is that the days on which TC did not write letters are excluded. Suppose there are N days on which TC wrote a letter to someone. We sort those N dates according to the calendar. Given a word w, we generate the sequence for w by setting, for each i, 1 ≤ i ≤ N, setting the value of the i-th entry of the vector to 1 if the word w appears in one of the letters written on the i-th date and 0 otherwise.
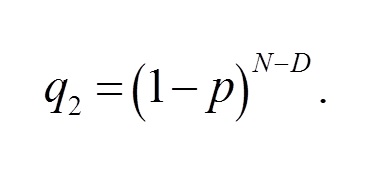
Given an N-dimensional vector v = (v1,…,vN) thus generated, we measure the concentration of 1’s in v as follows: Let M be the number of 1’s in v and let p = M?N. Let a and b be respectively the first and the last positions in which 1 appear in v. Let D = b – a + 1. We estimate the probability that an event that occurs with a uniform probability of p (a) occurs at least M times in D trials and (b) does not occur at all in N – dD trials. The former probability is:
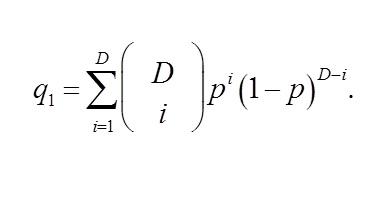
The latter is:
Since N is large and p is small for certain words, the two probability values can be very small. If you attempt to compute them, for many p the values quickly approach to 0. To solve this problem we use the minus of the logarithm of these values. The former is:
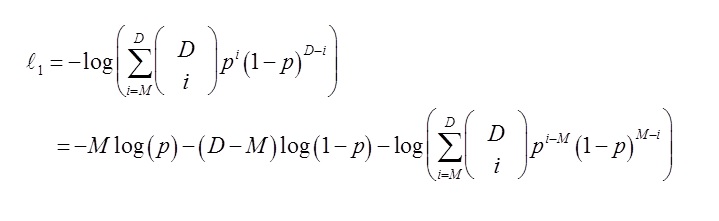
The latter is:
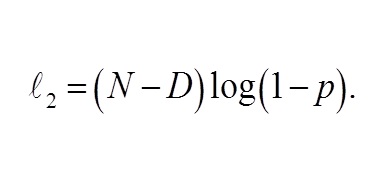
If the occurrences of 1s in v are monochromatic, that is, D = M, then ?2 is undefined since p = 1. Since ?2 approaches to +∞ as p approaches to 1, we use a constant that is the logarithm of a value very close to 0 if such a case arises. We choose -300 < log(10-130).
To make these two values interact with each other we use the product of the two, ?1 ×?2, to quantify the concentration. Given a set of words, we rank them using this concentration measure. Prior to the concentration measure calculation the plurals are converted to their singular forms and the verbs are converted to the first-person present form. To do this conversion we execute the following on each input word w:
- Using a look-up table of irregular verbs we look for a match. If there is a match, we use the first-person singular form of w instead of w.
- Run a spell checker (e.g., GNU Aspell) on w. If the spell checker does not find a match, then we use w as is.
- If the word does not end with an “-s”, a “-d”, an “-es”, or “-ed”, we use w as is.
- Otherwise, using WordNet5 as a dictionary we check whether the removal of the suffix produces a legitimate English word. If the word ends with an “-es” there are two choices for the removal: removing only the “s” at the end or removing the “-es”. Similarly there are two choices if it ends with an “-ed”. Otherwise, there is only one choice, either the last “s” or the last “d”.
The next series of plots presents the top 200 words in the ranking. The words are re-ordered in terms of their first occurrence.
Figure 8: The top 200 words in the concentration ranking (part 1).
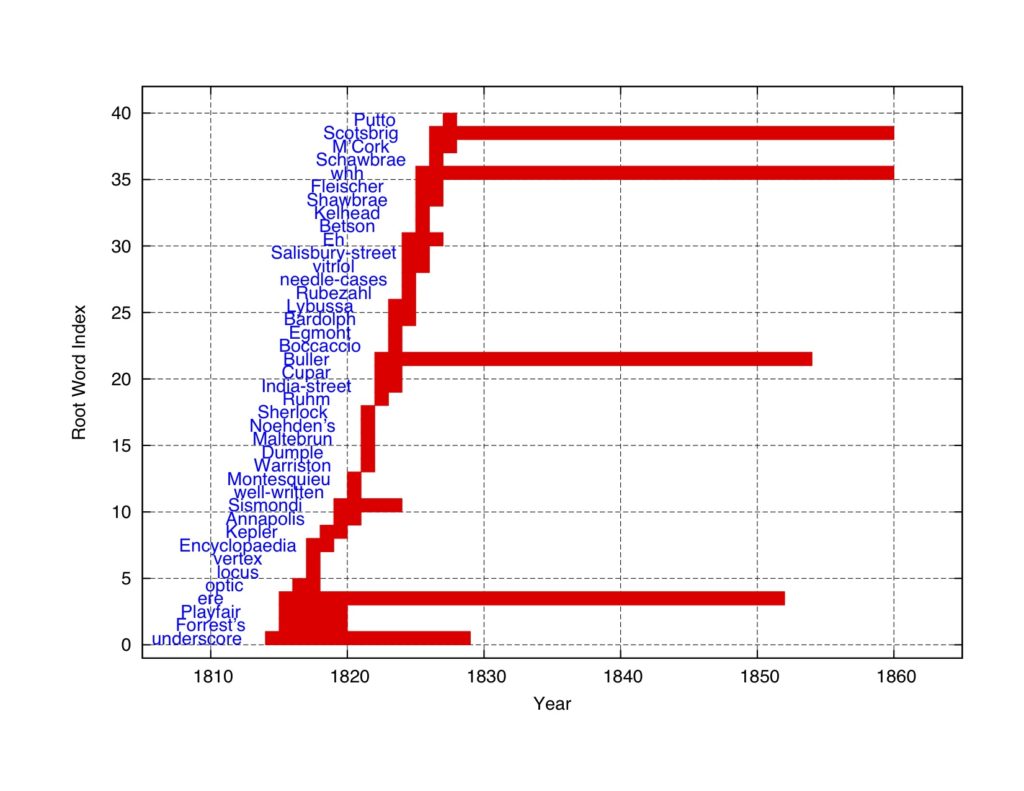
Figure 9: The top 200 words in the concentration ranking (part 2).
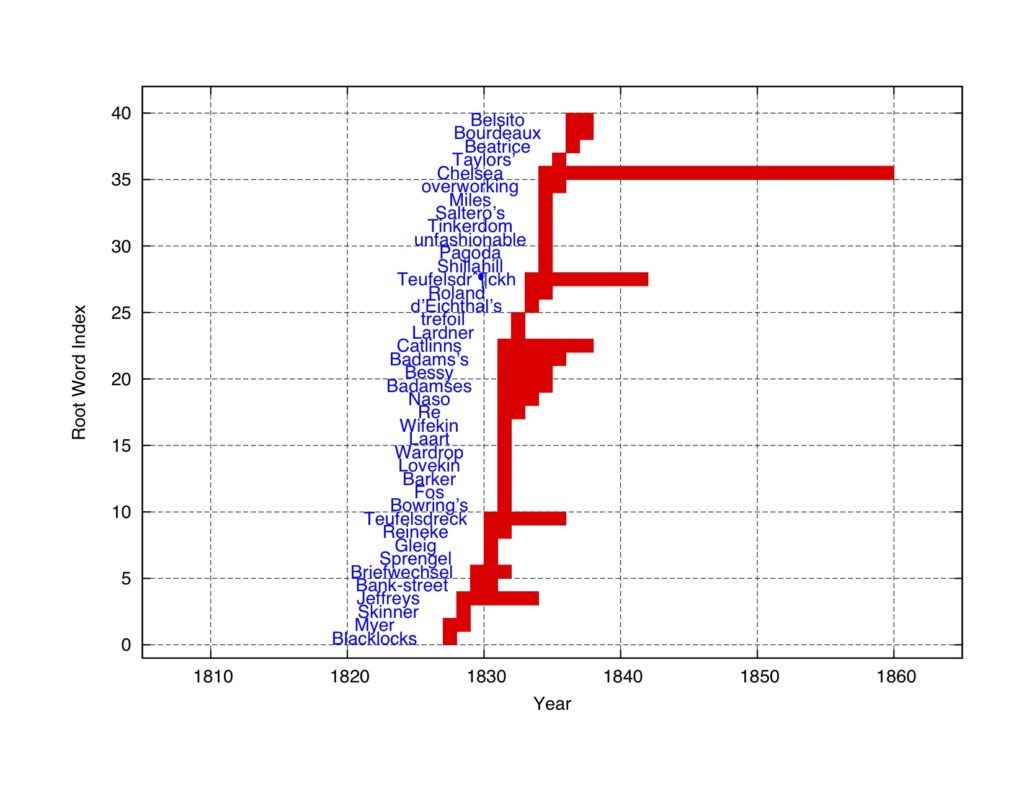
Figure 10: The top 200 words in the concentration ranking (part 3)
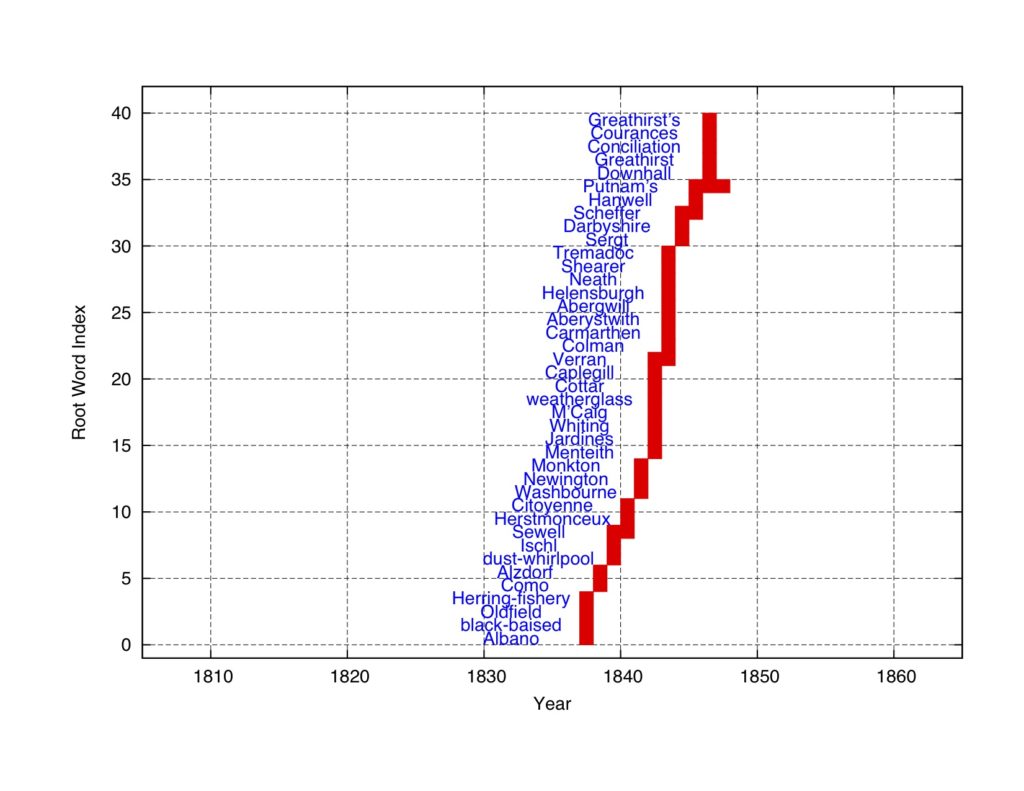
Figure 11: The top 200 words in the concentration ranking (part 4).
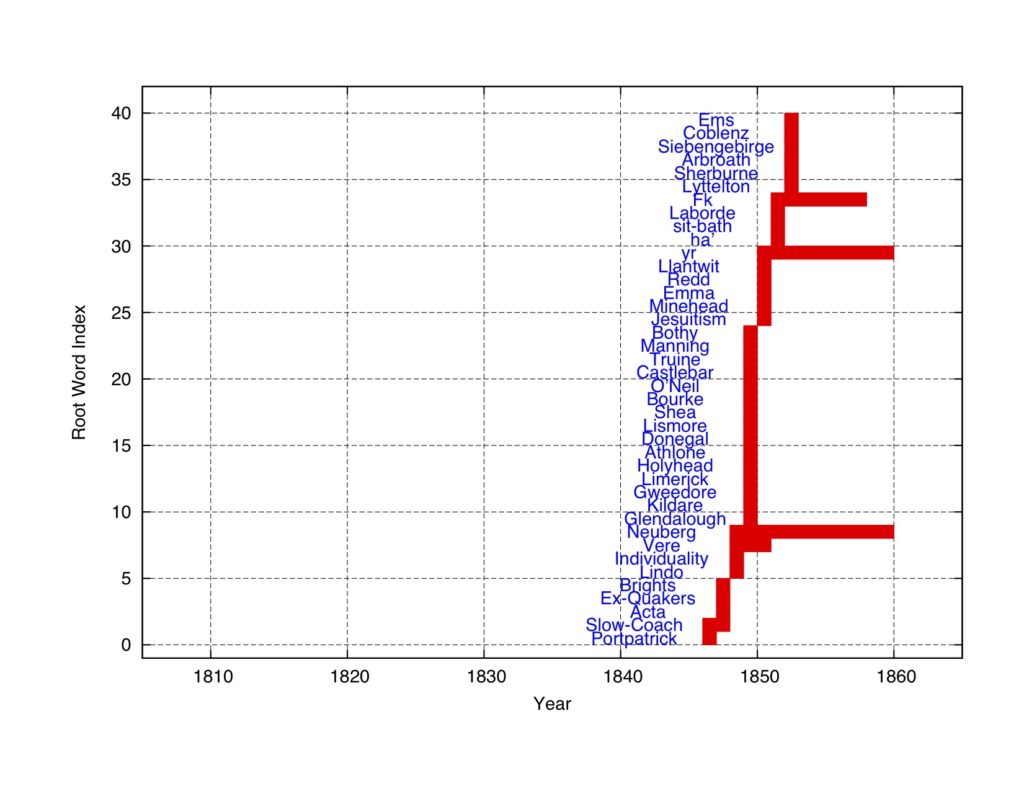
Figure 12: The top 200 words in the concentration ranking (part 5).

3.4. Distinctions Among Recipients
TC is known to have been able to write comfortably in such foreign languages as German, French, Italian, and Latin. By simple speculation we identify that foreign languages appear in his letters. We question whether he chose a specific language to a specific person. To study this question we attempt to identify words that are not proper nouns or initials that do not have a match in the English dictionary. For each of such words we run the spell checker Apsell four times, with the four languages as the locale, to see whether the word matches a word in the dictionaries. There are accented symbols or ligatures that are unique to French and those that are unique to German. Before running the spell checker we identify such symbols to filter out those words for which the language they belong to can be identified by accents. When the spell checker is run, a word may have a match in no languages or in more than one language. If there is none, then we treat the word as a non-proper-noun that is an abbreviation. For example, the suffix “-ment” is sometimes spelled as “-mt”or “-t”. If there is more than one match, we use the preference order of German, French, Italian, Latin to select blindly the language.
After the language identification we calculate for each letter v and for each language L ∈{ German, French, Italian, Latin } the proportion of the words in that letter belonging to L, which we denote as rL(v). Given a set of letters, we compute the average of rL(v) over the letters in the set to obtain the average proportion. We select the recipients to whom TC wrote at least 10 letters in the volumes 1 – 35 and computed the average proportion for each one of the selected recipients for each of the four languages.
The next two plots show for these recipients, the average proportions of German and of French on the vertical axis and the average letter size (in terms of the number of words) on the x-axis.
Figure 13: The proportion of German.
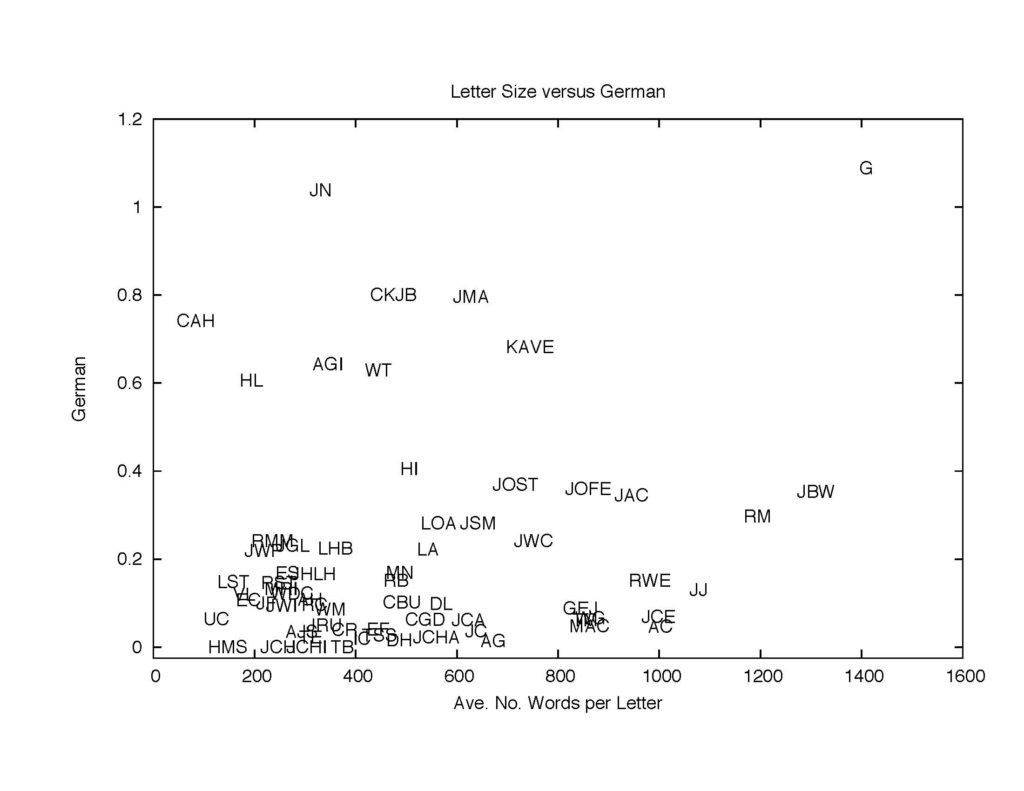
The “G” appearing in the German plot is the German novelist, artist, and politician Johann Wolfgang von Goethe, who TC admired. The heavy use of German appears to indicate his respect for him. Note also that the large average letter size. TC put many efforts in writing letters to Goethe.
Figure 14: The proportion of French.
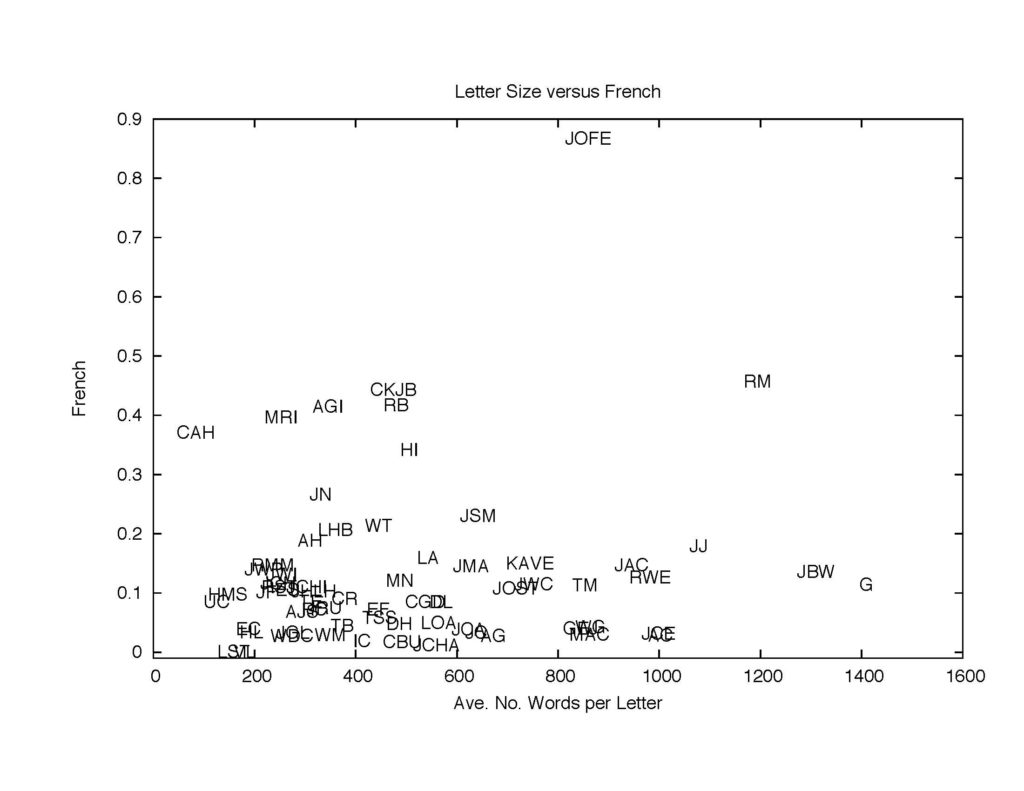
As for French, the person to which TC used the language the most is John Fergusson (JOFE in the plot), an English friend of his. The high proportion of the French use comes from one of the ten letters TC wrote to him, but in one of the letters to JOFE TC quotes a French writer Guillaume Thomas Raynal (1713–1796). Obviously this is not a direct French address to JOFE and this may show a limitation to the simplicity of the approach taken.
3.5. Emotional Level of Letters
We finally examine the emotions represented in the letters exchanged in the letters from TC to JBW (pre-marriage), the letters from TC to JBW (post-marriage), and the letters from TC to Harriet, Lady Ashburton (HLA). In the early 1850s, TC and HLA developed a close relationship that would serve later historians as the locus for describing the quality of the Carlyle marriage, which became a paradigmatic example of oppressive Victorian sexual politics. JWC articulated a distinct jealousy in her letters, just as TC expressed an intimate affection for HLA that has been read as inappropriate by many “close readers” of the texts. The charges and countercharges related to the quality of the Carlyle marriage make these letters a prime candidate for investigating the capabilities of distant reading in determining the emotional content of the letters. Our question is: if we calculate the emotional level in the letters in the three collections, does the emotional level provide circumstantial evidence that TC might have been emotionally closer to LAH than to JWC? To answer this question, we process the letters as follows.
- First we use the Stanford Core NLP 1.3.06 to parse the sentences appearing in the letters and then to compute the Parts-Of-Speech (POS) of each word.
- Next we use the WordNet7 to obtain the sense for English verbs, nouns, adjectives, and adverbs using the JAWS WordNet interface.8 For this purpose, we convert the plural nouns to their singular forms and the verbs to their first-person singular forms before querying the WordNet database with JAWS. If the query returns multiple senses for a query word with a specific POS, since the output of WordNet is in the order of the frequencies of use, we select the very first one.
- We use the SentiWordNet 3.09 to compute the emotional level of each word for which we identify a WordNet sense. The SentiWordNet Database is a single plain text file that can be read by a program and associates each word–sense combination to a positive sense value and a negative sense value. Each of these values ranges between 0 and 1. For each letter we compute the average positive sense value and the average negative sense value, by dividing the sum of each two types of sense values over all words for which the most popular sense has been identified by the total number of such words. We then compute the sense value of a letter by simply selecting the larger of the two average sense values.
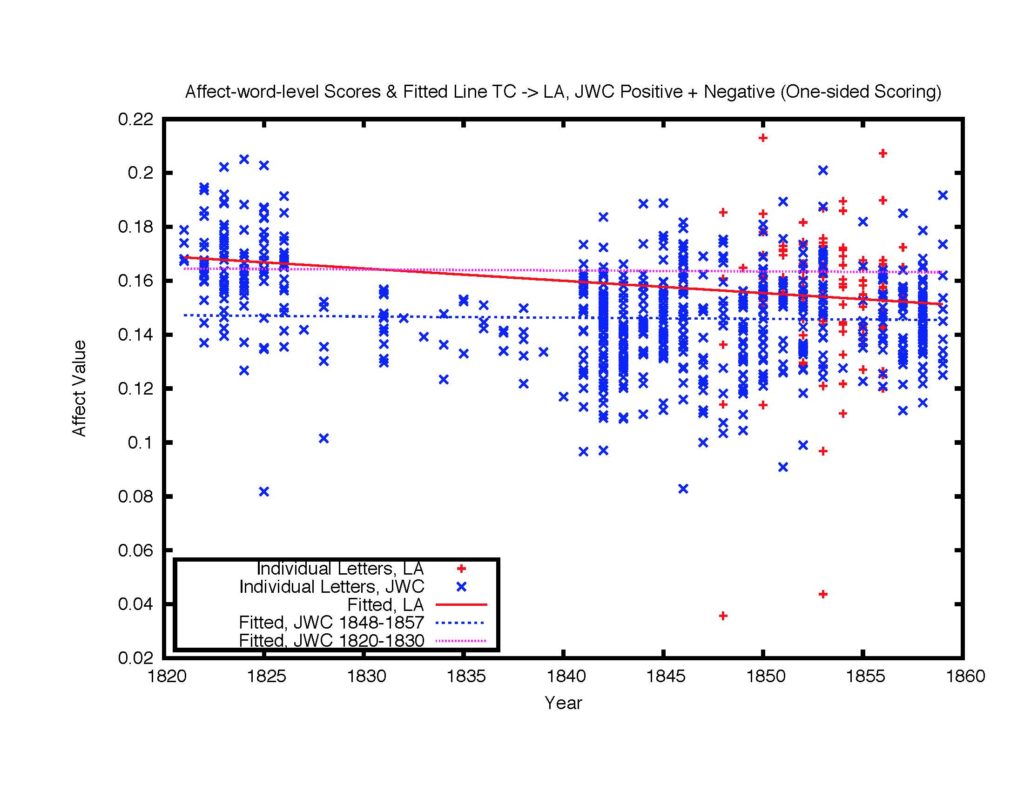
The figure below shows the plots of this emotional value of the three collections. The horizontal axis of the plot is the year. The points + and * represent individual letters, where +’s for the letters to LAH and ×’s for the letters to Jane Welsh. To the point collections we fit linear lines using the least squares method, as provided by Gnuplot. The lines in the plot are: the line for the emotional level to JBW, the emotional level to JWC, and the emotional level to LAH. In some sense each line represents the average emotional level per year over time. We observe that the line for JWC is clearly below the line for JBW and that the line for LAH is above the line for JWC. Although we do not seek specific phrases or look for affect words representing, we suspect that this chart can be viewed as evidence that TC was maybe closer to LAH than he was to JWC.
Figure 15: The emotional levels.
4. Conclusions and Future Work
This short article presents the experiment currently being undertaken to analyse the large collection of letters written by Thomas and Jane Welsh Carlyle. The time analysis confirms an earlier discovery by Barabási and Vásquez et al. that human activities follow specific bursty patterns. The bursty model analysis shows some difference between TC and JWC. When it comes to individual words, the burstiness plot is all over the map. We also study the emotional level of individual letters via parsing, word sense identification, and sentiment calculation. The plot of the emotional levels of individual letters over time may suggest that TC was less emotional to JWC after marriage than before marriage, and that he may have been more emotional to Lady Ashburton than to Welsh Carlyle after their marriage. Such conclusions, however, can only rest in the realm of conjecture until more robust means of calculating emotional content in the letters. Further, the recent publication of HLA’s letter to TC, which were recently uncovered and published in consecutive issues of the Carlyle Studies Annual (26-27; 2011-2012) reveal the other side of the correspondence between TC and HLA and make further inquiry requisite and fascinating, since scholars have made claims about these letters for more than 100 years without having the benefit of both sides of the story.
Our exploration is in an early stage and so more research is yet to be done. We specifically wish to address the following issues in our future work. First, we hope to be able to develop a better model for capturing burstiness of words. Second, we hope to conduct better parsing. TC has used German, French, Italian, and Latin in his letters. By correctly identifying the language being used, we can improve the accuracy in parsing. Third, TC and Jane Welsh use quite a bit of abbreviations (e.g., “Edinr” for “Edinburgh”) to save time and paper. We hope to study during which period which words are abbreviated, and whether those words represent the things that were occupying their minds.
5. Acknowledgments
The authors would like to thank The Duke University Press for graciously permitting us to use the letter data of The Carlyle Letters Online.
6. References
A.-L. Barabási. The origin of bursts and heavy tails in human dynamics. Nature, 435:207–211, 2005.
I. Campbell, A. Christianson, and D. R. Sorensen, editors. The Collective Letters of Thomas and Jane Welsh Carlyle. Duke University Press.
K.-I. Goh and A.-L. Barabási. Burstiness and memory in complex systems. EPL, 81, 2008.
S. Ramsay. Reading Machines. University of Illinois Press, 2011.
A. Vásquez, J. G. Oliveira, Z. Dezs_, K.-I. Goh, I. Kondor, and A.-L. Barabási. Modeling bursts and heavy tails in human dynamics. Physical Review, E73:036127, 2006.
G. Zhao, M. McDonald, D. Fenn, S. Williams, and N. F. Johnson. Transition in the waiting-time distributioon of price-change events in a global socioeconomic system, 2012. Electronic preprint arXiv:1212.2189 avialable at http://arxiv.org/abs/1212.2189.
- www.gutenberg.org
- https://republicofletters.stanford.edu/
- The Carlyle Letters Online. Duke University Press, 2007 http://carlyleletters.org.
- A. Clauset, C. R. Shalizi, and M. E. J. Newman. Power-law distributions in empirical data. SIAM Review, 51(4):661–703, 2009.
- G. A. Miller. WordNet: a lexical database for English. CommunicationsoftheAssociationforComputingMachinery, 38(11):39–41, 1995. C. Fellbaum, editor. WordNet:anElectronicLexicalDatabase. MIT Press, Cambridge, MA, 1998.
- http://nlp.stanford.edu/software/corenlp.shtml.
- G. A. Miller. WordNet: a lexical database for English. CommunicationsoftheAssociationforComputingMachinery, 38(11):39–41, 1995. C. Fellbaum, editor. WordNet:anElectronicLexicalDatabase. MIT Press, Cambridge, MA, 1998.
- B. Spell. Java API for WordNet Searching (JAWS). http://lyle.smu.edu/ tspell/jaws/index.html.
- A. Esuli and F. Sebastiani. SentiWordNet: a publicly avialable lexical resource for opinion mining. In ProceedingsoftheInternationalConferenceonLanguageResourcesandEvaluation,LREC2006, pages 417–422, 2006. S. Baccianella, A. Esuli, and F. Sebastiani. SentiWordNet3.0: an enhanced lexical resource for sentiment analysis and opinion mining. In ProceedingsoftheInternationalConferenceonLanguageResourcesandEvaluation,LREC2010. 2200–2204, 2010.