Insights provided by Digital Resources
by Tim N.L. Evans
1. Introduction
The data, analyses and hypotheses presented here arose from an early stage of research into the publication culture of modern archaeological excavations in mainland England from 1938 – the year of the first government funded archaeological excavations1 – to the present day. In the existing archaeological literature this period represents the transition and development of the subject from the preserve of a small antiquarian class to a large multi-faceted discipline that has become embedded in the planning process.2 However, as a consequence of this growth the discipline has been beset with well-publicised publication crises and a growing sense of unease concerning the lack of any consolidated record of archaeological investigations.3 Although in modern-day archaeological discourse we may use positive terminologies such as information flow4 and knowledge organisation,5 over the decades we as a discipline have not always precisely known who has done what and where to find the results; a requirement fundamental to a cyclical discipline such as archaeology.6
During the initial stages of the authors’ research it became evident that there is a distinct lack of insight into what may be called the ‘history of archaeological excavation’ in the country. Whilst discussions on eminent archaeologists and evolutions and revolutions within technique and theory are common,7 there is less material covering the when, what and where; and what this may tell us about the strengths and weaknesses of the subject. Although what may be cautiously termed ‘historiographies’ are not uncommon in archaeology, they are primarily concerned with the impact of particular archaeologists on the development of the discipline.8 However, it is perhaps ironic that in looking at the works of great men and women that helped move archaeology away from the study of kings and emperors towards a more Marxist influenced perspective on ordinary people, such studies overlook the same ‘mundane’ background of the typical excavation of the era. Considering the aforementioned recording and publication crises and difficulties, this is perhaps unsurprising; nevertheless it is an important omission in the reflective discourse required by any mature academic discipline.9 Furthermore, as archaeology is now for the majority undertaken as a response to planning applications,10 the knowledge base is fundamental to predicting where archaeology may be present and what mitigation or conservation should be undertaken. As archaeological knowledge now sits as an authoritative resource to be considered as part of the social and natural environment; surely an understanding of how we came to this juncture is critical, lest the subject face accusations of unreliability and bias.
In recent years the amount of digital data, especially inventories of archaeological works and monuments, available online has increased dramatically but perhaps with little or no fanfare. Because of this, it is now possible to access rich national datasets that provide a record of our works, and furthermore, to perform meta-analyses to identify trends in data collection to inform about the ‘history’ of the discipline. It is a simple case to move away from questions to do with conventional studies such as Romans or Bronze Age, and perhaps to ask how our perceived understandings have been created by our own interests and to examine the reflexive nature of the relationship between archaeology and broader society. The added advantage of using digital inventories is that they are often the only evidence for unpublished works11 that would otherwise not be incorporated in traditional literature reviews. If we consider the principals of information entropy in relation to the loss of information post-publication,12 the digital inventory may be considered a valuable metadata record of what happened; an alternative to the published synthetic literature. In addition, perhaps the most exciting aspect of this digital scholarship is the opportunity to analyse archaeological data alongside other data sources. It is this novel methodology that potentially allows us to view the discipline outside of the usual vacuum, and perhaps to see changes and revolutions in light of wider economic and social developments.
The following data and interpretations presented in this paper are based on the following digital resources presented or incorporated in this study:
- The English Heritage Excavation Index, an inventory begun in 1978 within the Royal Commission on the Historical Monuments of England (RCHME), as an attempt to separately record archaeological events being undertaken by the organisation. The transferral of Ordnance Survey (OS) site records in 1983 permitted retrospective expansion of the Index to cover events going back to the Second World War and beyond.13
- The ADS Grey Literature Library: a collection of digital unpublished archaeological fieldwork reports, the vast majority of which have been transferred from OASIS, a project designed to provide an online index to the mass of archaeological grey literature produced as a result of the advent of large-scale developer funded fieldwork.14
- Council for British Archaeology (CBA) index of Radiocarbon dates for Great Britain and Ireland.15
- Database of Archaeomagnetic dates, collated by the University of Bradford and English Heritage, from archaeological sites in the United Kingdom16
- Scheduled Monument Data for England; created and maintained by English Heritage.17
Other non-archaeological data sources were also consulted, including:
- Ordnance Survey (OS) datasets (Boundary line data) available under the OS OpenData Licence.18
- Super Output Areas (SOAs) The SOA boundaries are distributed by the Office for National Statistics (ONS) under the National Archives Open Government Licence OGL).19
- Indices of Deprivation 2007 for Super Output Areas produced by Department for Communities and Local Government (DCLG), distributed by the Office for National Statistics (ONS) under the National Archives Open Government Licence OGL).20
Using these digital resources and statistical and geographical analyses, the aim of this paper is to present an alternative to the traditional narratives covering the practice of archaeological investigation21 in the wake of the Second World War. This is not to say that this is paper represents a narrative or complete history, as such as work is beyond the scope of this piece, but rather to illustrate how previously unheralded digital resources can facilitate new insights. The following work presents several early analyses using the aforementioned resources, and discusses how they can augment or contradict existing narratives. Furthermore, the study combines archaeological and non-archaeological data at a national level to examine if the subject interacts with the wider social and economic backdrop.
2. Identifying Basic Trends
As has been highlighted, the primary aim of this digital study was to move away from a simple linear approach to the study of the archaeological discipline, and to reflect on how the practice evolved, changed or was affected by wider factors. For example in many traditional studies, the development of archaeological investigation is presented as a simple rise in numbers, with documentary sources of the period detailing the growth of the practice.22 When viewed in this basic fashion, any such study is really little more than an overview in which we witness an inexorable march towards the present-day culminating in hitherto unprecedented levels of archaeological work. Yet, because of the availability of digital inventories we may begin to question the reality of this scenario. As a cursory examination of the data shows, the numbers of investigations per year is not just a simple rise; furthermore, if we look at a small period in detail (Figure 1) and compare it against, for example, economic data, trends between the two instantly become apparent. In this case we can see the impacts of the 1973-1976 and 1979-83 recessions upon archaeological work: a significant drop in events in both cases, but also in the case of the latter the advent of the smaller ‘evaluation’,23 compared to the more traditional set-piece excavation.24
Figure 1: Numbers of archaeological excavations and evaluations in England 1938-2007 compared to GDP.
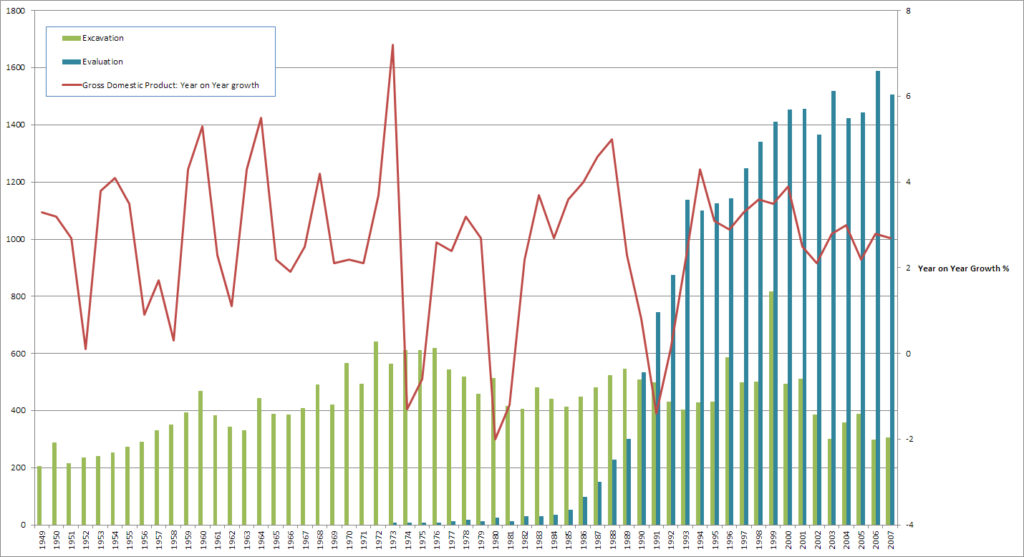
Data sources i) English Heritage Excavation Index ii) Adapted from data from the Office for National Statistics licensed under the Open Government Licence v.1.0. United Kingdom, Office for National Statistics (2012): Gross Domestic Product: Year on Year growth, 28 June 2011.
The key turning point in this data is undoubtedly the year 1990, when recession coinciding with a major piece of planning guidance25 leads to a decrease in the bigger interpretative excavation and the growth of the smaller evaluations. Although there is resurgence in large scale projects in the late 1990s, this generally gives way to smaller evaluative exercises as part of the planning process. Perhaps because of the seemingly large number of events, there is the temptation to assume that there is perhaps less to explore or to explain,26 an attitude of a subject secure in its knowledge base and able to react to threats accordingly. But it may also be argued that it is a subject intrinsically linked to fluctuations in the national economy – put simply if there is no infrastructure development or construction projects there is less work, and then that work is mainly evaluative. This discernible link between archaeological investigation and national economics is hardly surprising; indeed it has been noted by others,27 however what has not been studied is the link between economy and archaeology in different geographic areas. Thus when the levels of investigations are broken down into the English regions (Figure 2), the data suddenly shows an uneven geographic distribution. In these figures, the impact of the 1973 recession can be seen having a clear impact on all regions, and although all areas recover, this trend of recovery is particularly striking in the Southeast and Southwest regions. By the time of the early 1980s recession most areas had recovered to some degree, however all areas bar the West Midlands see a dramatic fall between 1980 and 1981 (that region dips 1981 to 1982). What is again clearly evident is that the Southern regions recover quickest and rise back to pre-recession levels within two or three years. By the end of this particular period the vast majority of archaeological work is clearly taking part in the South of the country. Even at a cursory level, what these figures tell us is that within the practice of archaeology in England, there is clearly an apparent north-south divide; at this juncture we may enquire as to the factors that have created this scenario.
Figure 2: Numbers of archaeological excavations and evaluations in England 1972-2007 split by English region.
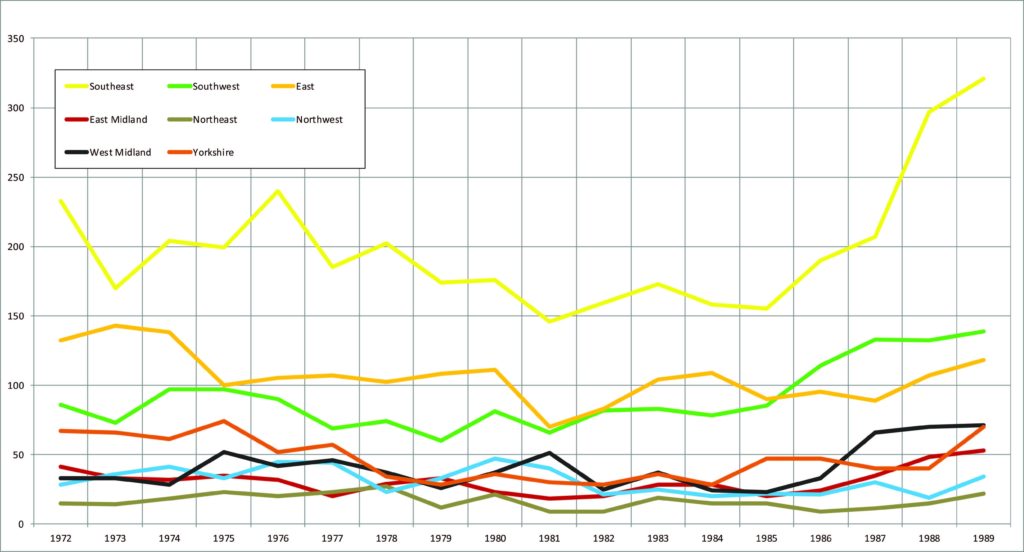
Greater London not included. Data Source: English Heritage Excavation Index.
A simple explanation for these results is that the southern regions have a greater land area and population, and thus statistically the higher number of events. Certainly this is a factor, but a basic analysis still shows that the Southeast/Southwest/East zone has a significantly higher density of work per square kilometre (Table 1). Furthermore, if we consider the density of population – and the levels of development that occur with expansion of settlement and infrastructure – it may be asked why, for example do the West Midlands and the Northwest not have a similar level of excavations to the Southeast? If we also factor in the density of scheduled monuments this may well explain the focus of excavations in the Southwest and Yorkshire and Humber, as extant remains such as stone circles or abbeys attract interest. The reverse of this logic is perhaps apparent in the Northwest, with the region having the lowest density of monuments and also the lowest density of excavations. However the same pattern does not apply to the Northeast, which has a high density of monuments but relatively low number of investigations. Clearly there are other factors affecting where excavation is taking place, as we have seen economy may be one, but it is also suggested that socio-cultural factors within the history of the discipline may be playing a significant role.
Table 1: English regions by area, population, scheduled monuments and excavations.
| Region | Area (km²) | Population (2009) | Population density | Scheduled Monuments | Density of monument | Excavations 1938-2007 | Density of excavations |
| Southwest | 23,837 | 5,231,000 | 219.44 | 8732 | 0.366 | 8372 | 0.351 |
| East of England | 19,120 | 5,767,000 | 301.62 | 2167 | 0.133 | 9714 | 0.508 |
| Southeast | 19,096 | 8,436,000 | 441.76 | 3123 | 0.163 | 15870 | 0.831 |
| East Midlands | 15,627 | 4,451,000 | 284.82 | 1772 | 0.133 | 3994 | 0.255 |
| Yorkshire and Humber | 15,420 | 5,258,000 | 340.98 | 3050 | 0.197 | 3880 | 0.251 |
| Northwest | 14,165 | 6,898,000 | 486.97 | 1590 | 0.112 | 2367 | 0.167 |
| West Midlands | 12,998 | 5,431,000 | 417.83 | 1576 | 0.121 | 3637 | 0.279 |
| Northeast | 8,592 | 2,584,000 | 300.74 | 1594 | 0.185 | 1794 | 0.208 |
Greater London not included. Data Sources: i) English Heritage Excavatio Index; ii) Scheduled Monuments for England iii) Adapted from data from the Office for National Statistics licensed under the Open Governement Licence v.1.0. United Kingdom, Office for National Statistics (2012). Source: Regional Trends Online Tables (September 2010).
3. Towards a History of Archaeological Excavation
At the time of writing, any undertaking of a cultural study of post-war archaeological investigation in England via published sources is still hindered by an absence of published sources and the dearth of such sources in a digital format. Despite early advances in NLP based analysis of digital archaeological journals,28 several key journals such as the Proceedings of the Prehistoric Society are still in hard-copy only. Thus instead of traditional published sources, we can turn to the readily available databases and inventories. It should be noted that when using any database there are of course issues with gaps29 and the reality is that these databases are not themselves objective records but social constructs;30 nevertheless, they do present the most complete record of archaeological works available to the researcher at this time.31
As has previously been highlighted, any cultural study of the history of excavation is presented with the watershed year of 1938; when government funds were first used to pay for archaeological excavations on sites due to be destroyed by military defence works in the build-up to the Second World War.32 In this traditional chronology the years prior to the Second World War are a precursor to the modern ages, with a distinct ’culture’ of gentleman antiquarians working leisurely and towards research. The narrative continues that following the end of the war, and in-line with the Keynsian boosting of the economy, government funds continued to be directed to excavations in advance of widespread re-building and reconstruction.33 Thus in these few short years, English archaeological practice had changed irrevocably. In one of the few pieces to look at the history of the development of archaeology in England, 1950 is identified as a pivotal year when modern archaeology was born.34 It is tempting to re-examine this in light of our digital inventories. For example, we may look more closely at the works undertaken at the beginning of our modern age to see if there was really such a dramatic shift within the practice of archaeology.
Spatial analysis (Figure 3) clearly indicates that the pre-war period contained a high number of investigations – perhaps more than may be expected through the traditional narratives – and that there are distinct concentrations in the Southeast, Southwest, East and the vicinity of Hadrian’s Wall. It is interesting to note that although the inter-war years represent an understandable hiatus in this growth, there are still 476 records for this period; a not-insignificant number. When compared with excavations from the previous seven years there is no drastic difference in the geographical location of these investigations, and broadly speaking a notable rural southern bias seems to have been maintained throughout the pre and inter-war periods. There are certainly less events, but events still seem to be located in the same places – notably the Southeast (excepting Greater London, Surrey and Kent), Southwest (notably Dorset and Wiltshire) and East of England (primarily Norfolk), as well as (again) Hadrian’s Wall. One notable difference is the distinct drop in excavations in East and West Sussex during the war, undoubtedly a reflection of its geographic role in the national front-line. This exception aside, one can begin to hypothesise about the established existence of a predominantly southern archaeology that appears remarkably resilient to the outbreak of war. We may consider that the threat of invasion from the continent necessitated works such as airfields in the central southern interior that required archaeological work.
If we compare the post-war period, there are certainly more excavations, but the concentrations seem to be corresponding with the pre-war period. So for example, there are marked densities within both periods in: non-fenland Cambridgeshire, Norfolk and Suffolk in the East; Somerset, Oxfordshire and Gloucestershire in the Southwest; and Sussex and Surrey in the Southeast. There are disparities, notably increased work in urban centres such as Exeter and London as well as work in the East Midlands and part of North and East Yorkshire. However, the picture is very much one of continuation of a theme. Thus we may begin to suggest excavation continued in the same areas as before the war as it was the same individuals and/or societies, effectively working in the same areas (i.e. where archaeology was known to exist). Thus, although the prompt of some of the work may have changed, the people doing the work were on the whole very much the same, that is to say if not the same individuals then of the same cultural product, an archaeological society.
Figure 3: Excavations in England a) 1930-1937; b) 1938—1945; c) 1946-1953.
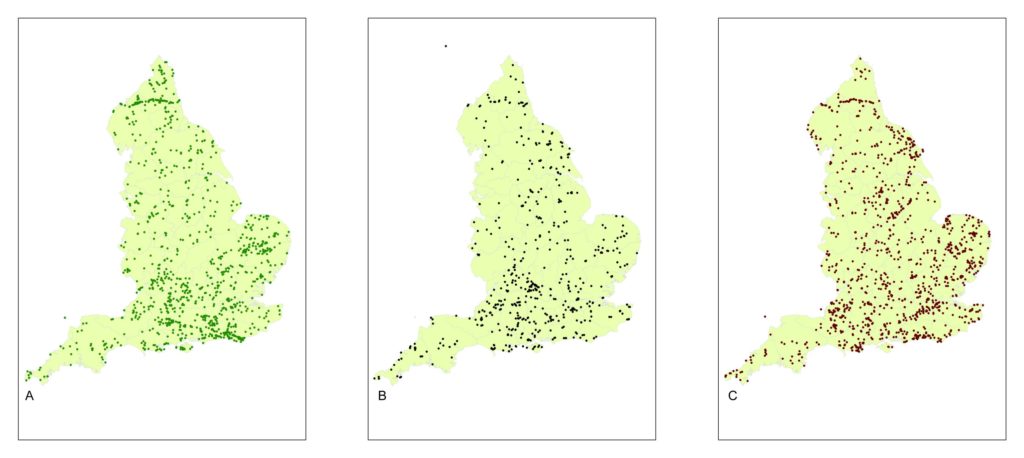
Data Source: English Heritage Excavation Index.
An analysis of the same data can determine who exactly was undertaking this work (Table 2). At first glance this provides some very clear results as the Ministry of Works does indeed become, by a clear margin, the leading and single largest undertaker of fieldwork in the country post-1938. Clearly, the impact of the war and then post-war development has had an impact on the discipline. Another interesting theme is the relative drop in ‘Private’ individuals undertaking fieldwork, the practice of archaeology is obviously becoming dominated by the amateur organisation or learned society. This can be interpreted as representing a shift to a more ‘organised’ practice with a commonality of standards, but also a decline in individualism and a shift towards accepted interpretation. In this light, we can perhaps connect this to the clear indications of continuity throughout the periods, and the continuation (and indeed) success of several organisations such as the Norfolk Research Committee, Surrey Archaeological Society and the Oxford University. This is perhaps counter-balanced by the emergence of organisations based around urban centres such as Roman and Mediaeval London Excavation Council and the Lincoln Archaeological Research Committee. Clearly there are forces of change and continuity at work here, but what is striking is that by the post-War period the most productive organisations are those based in the southern regions.
Table 2: The ten most common excavating organisations for the period 1930-1953, split by pre/inter/post war sub-periods.
| Pre-War: 1930 – 1937 | Inter-War: 1938 – 1945 | Post-War: 1946-1953 | |||
| North of England Excavation Committee | 46 | Ministry of Works | 81 | Ministry of Works | 105 |
| Durham Excavation Committee | 32 | Oxford University Archaeological Society | 24 | Norfolk Research Committee | 54 |
| Private | 24 | Norfolk Research Committee | 10 | Canterbury Excavation Committee | 48 |
| Norfolk and Norwich Archaeological Society | 21 | Durham Excavation Committee | 9 | Roman and Mediaeval London Excavation Council | 29 |
| Oxford University Archaeological Society | 22 | Ipswich Museum | 9 | Ipswich Museum | 25 |
| Devon Archaeological Exploration Society | 19 | Private | 9 | Museum of London Guildhall Museum | 19 |
| Norfolk Research Committee | 15 | Exeter Excavation Committee | 8 | Durham Excavation Committee | 18 |
| Society of Antiquaries London | 14 | Devon Archaeological Exploration Society | 7 | Private | 16 |
| Cambridge Antiquarian Society | 13 | Surrey Archaeological Society | 7 | Oxford University Archaeological Society | 13 |
| Surrey Archaeological Society | 12 | Canterbury Excavation Committee | 7 | Lincoln Archaeological Research Committee | 11 |
Data Source: English Heritage Excavation Index.
The Excavation Index does allow a broad overview of the types of ‘monument’ excavated during each event, and the results are of interest. The most frequent monument excavated across the pre/inter/post war period was ‘settlement’, followed by rather mundane generic classifications such as ‘building’, ‘pit’ and ‘road’. The preponderance of ‘settlements’ is perhaps a repercussion of the retrospective recording of these archaeological events, with it being a convenient catch-all term applied to anything that looks in the record as not being definitively ritual or defensive. However a far more insightful analysis may be to examine the monument class as well as the archaeological period. These statistics (Figure 4) demonstrate that prior to 1938 archaeology in England was predominantly concerned with Roman remains – hardly a surprise given the classical antiquarian roots of the subject – closely followed by Bronze Age, Medieval and then Iron Age sites. Given the growing status of the Prehistoric Society35 Bronze-Iron age excavations are not surprising. The opposite may be said of Medieval sites, with the Society of Medieval Archaeology not established until 1957.36 Analysis of the records shows that Medieval archaeology is dominated by defence and ritual/religious/funerary monuments; in other words the castles and abbeys. Bronze Age (and to a lesser scale Neolithic) archaeology is predominantly of a ritual type. Iron Age sites are less funereal; more defensive (hillforts) but equally concerned with a more domestic type of archaeology.
Of interest is that inter-war the frequency of Medieval, and Early Medieval, excavations increases over this period, analysis of the data shows that the majority of the former are defensive (i.e. castles) and the latter funerary. It is tempting to look for some kind of impact on these slight shifts by the significant events of the war, either a reaction to the reality of a defended island nation, anti-German feeling or nationalism. For example much has been written about the role of archaeology as a political tool in the dictatorships of contemporary Europe.37 However, probably because there was no real state-sponsored archaeology (Ministry of Works notwithstanding), there seems to have been no real national agenda outside of the interests of the ‘local’ societies. It may be argued that the undimmed fascination with Roman remains reflects an Imperial mind-set, but this is likely to have been ingrained since the nineteenth century38 and unlikely to have been triggered by the war. This lack of evident nationalism in archaeological fieldwork is perhaps unsurprising given the dark warnings against monopolistic state controlled/sponsored research at the 1943 Conference on the future of Archaeology.39 Perhaps the irony of this (understandable) anti-nationalist stance was that, as has been demonstrated by the analysis presented above, the archaeology of the time was already a social and cultural product. It is evident that the majority of work undertaken was influenced by what has been labelled a “power of tradition”,40 and although unique individuals’ demonstrated new approaches and threats required additional work often undertaken through government funding, English archaeology was still influenced by its antiquarian roots.
However, post-war, the data shows a demonstrable shift towards more excavations of Early Medieval, Medieval and Post Medieval monuments. Of interest is a significant shift from defence and funerary monuments to domestic and Industrial, particularly for the Medieval period, clearly a shift of attitude is evident. However although there is a relative decrease in Bronze Age sites, barrows are still – settlements aside – the most frequently excavated single monument type. Furthermore, interest in Roman archaeology continues and in fact increases during this period. Thus, although we do indeed see a change in the type of archaeology being excavated, it is in tandem with a continuation of past interests and traditions. This picture is also symptomatic of a growing urban and rural split – the countryside the domain of the barrow and the villa, the town that of Medieval historic centres. As a sub-trend to this split, it seems that the (previously highlighted) geographic location of excavations had not significantly changed; thus although more Medieval archaeology was being undertaken, it was more likely to be investigated in centres such as Exeter, Winchester, Ipswich or Bristol.
Figure 4: Excavations 1930-1937; 1938—1945; 1946-1953 classified according to the type of archaeological monument investigated.
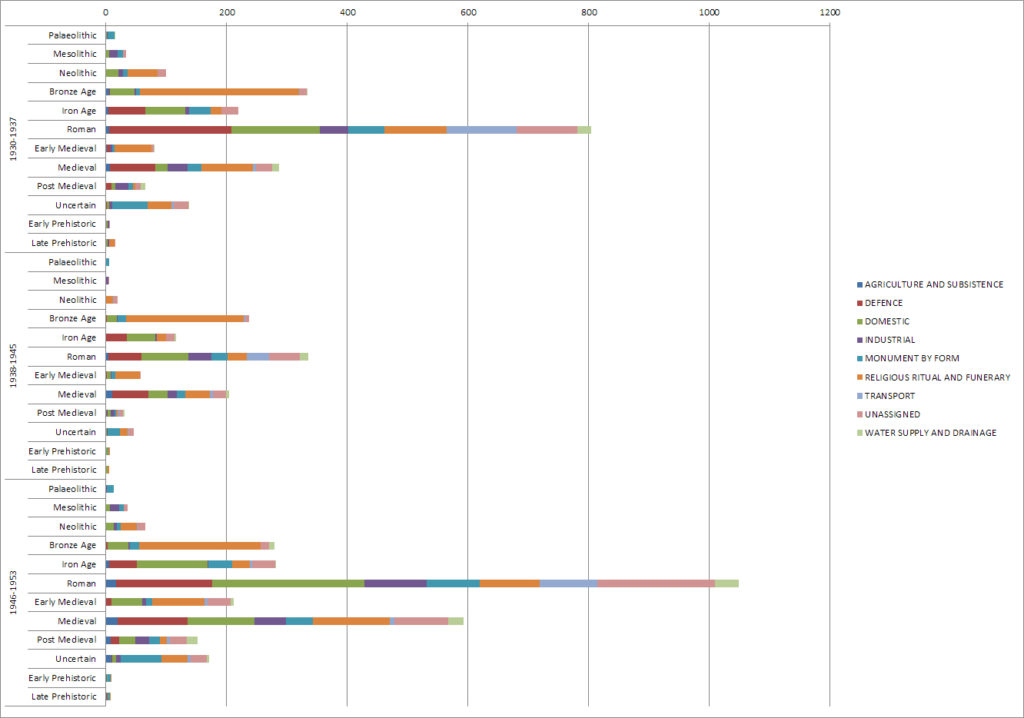
Data Source: English Heritage Excavation Index.
It is arguable that despite innovations and an element of change, archaeology was/is locked in a self-fulfilling prophecy, and geographically has begun to create a nascent core and periphery of archaeological investigations. It is interesting to note that in modern times, other digital scholars have begun to identify similar themes in the archaeological record; to borrow from a recent digital analysis of published journals:
“Often the archaeological work that results from these processes becomes the source of a cycle whereby these time periods and places appear to become more important than others simply because they have been investigated and described. This material itself thereby provides the fuel for ongoing dialogue, additional investigation and further publication. At the same time, other areas and time periods assume a secondary importance and come to occupy a peripheral place in the broader narrative of the past.”41
Thus if we create look at the composite picture of the location of excavations since 1938, we are faced with an interesting set of results (Figure 5). There is indeed a demonstrable trend in all periods for the location of archaeological investigations in the same locales. Indeed, one could arguably look at the pre-war areas and notice a more heterogeneous assemblage than that of 1990-2007. Although the 1960s and 1970s do witness an ‘expansion’ of work outside of the core areas into the South and Eastern Midlands, by the 1970s and 1980s the pattern has shifted back to a very central southern concentration. By the 1990s and the turn of the millennium this trend has intensified, with relatively less work in what may be called the peripheral zones; put simply, although we are statistically undertaking more work than ever before, it is in the same areas.
Figure 5: Weighted kernel density surface (Gaussian kernel, s = 10km) of archaeological investigations in England; a) 1900-1937, b) 1938-1971, c) 1972-1989 d) 1990-2007.
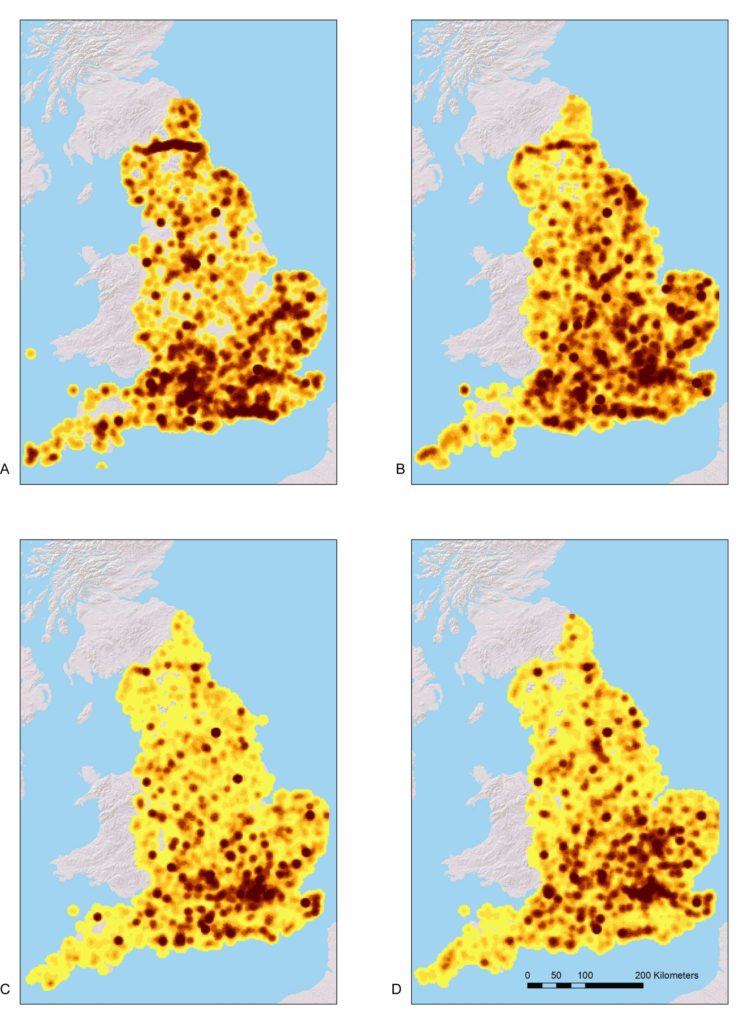
Data Source: English Heritage Excavation Index.
This distinct geographic bias may come as a shock to some in the archaeological profession. In the wake of PPG16 and development funded archaeology, a key overview of the period summarised thus:
“The development process, driven by economic and political considerations, introduces a randomizing element to the gathering of archaeological data, resulting in investigations and discoveries that would probably not have occurred through purely problem orientated or curiosity-driven research strategies”42 (my emphasis).
Clearly this is holds true for the most part, and the large-intensive works sponsored through the commercial development of the landscape hold testament to the mass of data being produced.43 However, the results presented here would argue that this ‘randomization’ is limited to geographic lacunae. Furthermore, if we consider other sources of digital information we can see the affect this bias has on other core datasets used both by commercial and academic archaeologists. For example, an important digital resource is the Grey Literature Library (Table 3) held by the ADS, presenting unpublished reports online. Whilst this is an undoubted achievement, the production and presentation of reports is itself a product of the aforementioned geographic bias. In this basic statistical analysis we can see that fieldwork reports are more likely to be online if they were produced in the core Southern zone. The reasons for this are varied, and it should be noted that the East of England was an OASIS pilot area,44 so is perhaps over-represented. However, it is an undoubted reflection of the cultural and economic factors at play in the formation of our archaeological record; a recent review of the OASIS system highlighted the varied uptake and use of the system by the HER45 which is in turn a reflection of the varied funding and resources available to each HER based on County Council priorities.46 Thus it may be suggested that a well-resourced HER has more time to devote to the use of the OASIS system. Thus what the corpus of reports actually represents is an indication of the success of information flow from excavation (or evaluation) to record.
Table 3: Archaeological fieldwork reports transferred from OASIS to the ADS Grey Literature Library, by English region.
| Region | OASIS reports in the ADS for years 2005-2007 | Investigations for 2005-2007 | Percentage of works available digitally |
| Southeast | 689 | 1665 | 41.38 |
| East | 719 | 1210 | 59.42 |
| Southwest | 390 | 781 | 49.93 |
| East Midlands | 216 | 471 | 45.85 |
| West Midlands | 120 | 352 | 34.09 |
| Northwest | 55 | 271 | 20.29 |
| Northeast | 62 | 374 | 16.57 |
| Yorkshire and Humber | 40 | 387 | 10.33 |
Southeast incorporates Greater London. Data Sources: English Heritage Excavation Index, Grey Literature Library and OASIS.47
Thus, as archaeological projects in the UK and England begin to focus on large, synthetic interpretations on a national scale48 it is clear that the material they are working on is fundamentally and very clearly a product of the fragmented state of archaeology in England. This also has a bearing for digital scholars; as technologies such as NLP become more common in archaeology it is critical to highlight that even before the analysis has been undertaken, the information base is already skewed in favour of this core region. As alluded to above, it may be expected that we should not be surprised by the results of these projects; however it is notable that such problems are not always highlighted as much as they should be. As a final point, we may also see this bias manifest in our absolute chronological dates (Figure 6), the clear indicator of an advanced, modern, scientific archaeology. In this brief geographic analysis it is evident that the sheer weight of chronological data is based on the Southern counties, with North Yorkshire as a notable exception. Thus we are able to produce precise chronologies and informed discussion of certain areas,49 but not of others. This of course poses questions for scholars and the writers of research frameworks and agendas, but also for those with an interest in archaeology and notions of heritage. As England (And the UK) lingers in economic recession, increasing emphasis is placed on localism, but also the increasing gap between rich and poor. Thus, as highlighted in the first section of this paper, it is pertinent to ask if the trends identified here are symptomatic not of purely geographical factors, but also the society in which archaeologists work.
Figure 6: Density of Radiocarbon and Archaeomagnetic dates in England for Districts IN England.
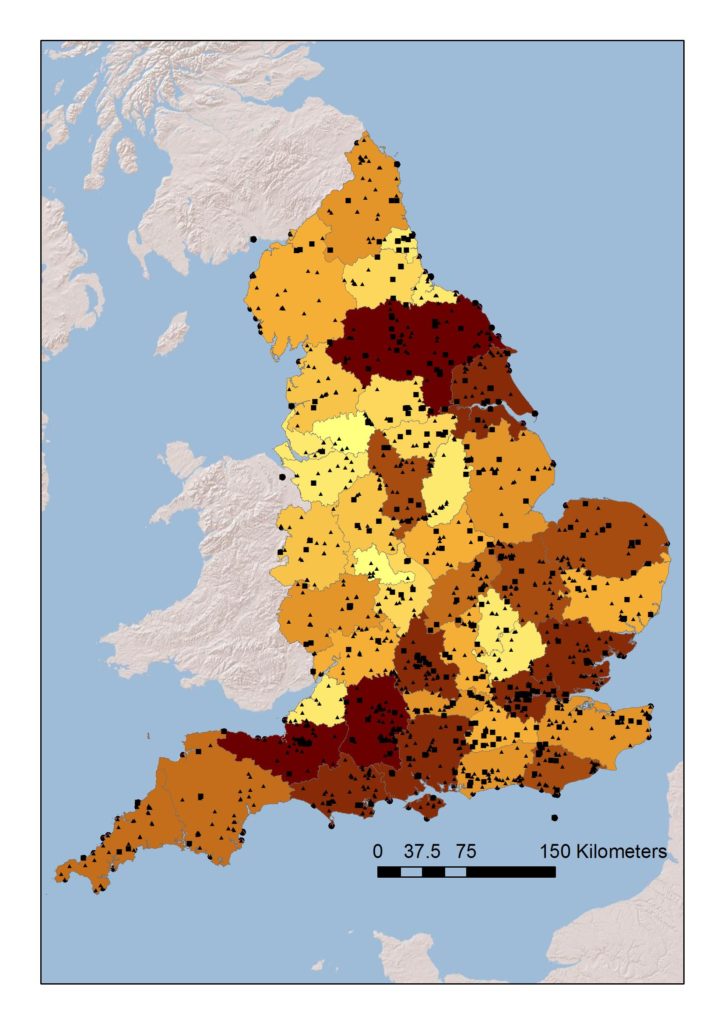
Data Sources: i) CBA Radiocarbon database; ii) Archaeomagnetic Database iii) Ordnance Survey (OS) datasets (Boundary line data) available under the OS OpenData Licence.
4. Archaeology and the Economy
In order to investigate further, this ‘divide’ can be examined using additional sources of non-archaeological demographic and economic data such as employment statistics (Table 4). Several trends are evident: the Southeast and Southwest have a markedly higher number of archaeologists as a percentage of population; the Southeast is dominated by field archaeologists, the Southwest by those based within Historic Environment advice and information. If we compare the Southwest to regions with similar populations such as the East or West Midlands, the discrepancy is even more marked. By far the most interesting statistical trend is that the Northeast, which has a higher than average number as a percentage of population, but of these the majority are field archaeologists as opposed to those in Historic Environment. It is well-recoded that archaeological fieldwork is a transient occupation 50, with long-term projects or larger excavations perhaps skewing that category. I would argue that the most important figure for the safeguard of archaeology is the number of individuals based within the HER or local councils – those reading the planning applications, setting the briefs, and maintaining the record. It is perhaps a telling indicator that those regions with the highest unemployment also have the lowest number of archaeologists, and furthermore have lower number of HER based archaeologists. As alluded to above, also indicates that certain areas are affected by and arguably contributing to a dichotomy in English archaeology between the ‘haves’ and the ‘have-nots’. This situation and threat, has not gone unheeded,51 and at the time of writing with government cuts affecting County Councils and thereby the ability of an area to mitigate for archaeology the situation is perilous.52 What the results presented throughout this paper indicate is that this threat may well be greater in certain areas – those without a visible and publicised history of archaeological work.
Table 4: Numbers of archaeologists compared to population, unemployment and average earnings for English Regions.
| Region | No. of archaeologists (2009) | Population (2009) | Archaeologists as % of population | Unemployment 2007/2008 (%) | Field archaeologists | HER |
| East | 505 | 5,767,000 | 0.009 | 4.2 | 289 | 134 |
| East Midlands | 500 | 4,451,000 | 0.011 | 5.2 | 315 | 152 |
| London | 665 | 7,754,000 | 0.009 | 6.7 | 334 | 153 |
| Northeast | 319 | 2,584,000 | 0.012 | 6.4 | 187 | 67 |
| Northwest | 366 | 6,898,000 | 0.005 | 5.7 | 202 | 109 |
| Southeast | 1091 | 8,436,000 | 0.013 | 4.1 | 751 | 191 |
| Southwest | 934 | 5,231,000 | 0.018 | 3.8 | 498 | 314 |
| West Midlands | 467 | 5,431,000 | 0.009 | 6.3 | 204 | 176 |
| Yorkshire | 590 | 5,258,000 | 0.011 | 5.2 | 284 | 160 |
Data Sources i) doi:10.5284/1000407,53 ii) Adapted from data from the Office for National Statistics licensed under the Open Government Licence v.1.0. United Kingdom, Office for National Statistics (2012). Source: Regional Trends Online Tables (September 2010).
It is pertinent to ask, have we created our densely studied zones based on long-standing biases of visibility, proximity and interest? On the one hand we can ask if these are the products of biases in the location of work, but on the other we can also look at how preconceptions of the evidence based on southern-centric evidence based has influenced methodology and interpretation. Several authors have discussed the concept of archaeology as a social and cultural product,54 and it is tempting to see the results presented here in much the same light: the influence of culture and society on archaeology and in turn a subsequent self-perpetuating situation in fieldwork and derived knowledge. Having this data in digital form allows us to delve deeper and attempt to visualise this potential link between socio-economics and archaeology by comparing archaeological and non-archaeological datasets. One of the most useful units of measurement is the Lower Super Output Areas (LSOA).55 A whole range of comparisons are possible, but to focus on one – excavations mapped against the Index of Deprivation (Figure 7) – it is possible to speak more specifically about the link between socio-economics and archaeology. For example, there are definite correlations between economically wealthy areas in Gloucestershire, Wiltshire, southern parts of Worcestershire and Warwickshire, Oxfordshire, Cambridgeshire, Hertfordshire and North Yorkshire and high levels of archaeological investigation. Reversely, economically deprived areas such as parts of the West Midlands and South Yorkshire have much lower level of excavation. At a national level, of those Lower Super Output areas with 0-1 excavations 59% are in the top quarter of deprived areas, this figure rises to 89% when expanded to the top half of deprived areas (Figure 8). It therefore does appear that there is indeed a very real North-South divide, but that this is only in fact increasingly part of an overall disparity between rich and poor areas in the country.
Figure 7: Index of Deprivation for LSOA (left) compared to Excavation Index counts for LSOA (right).
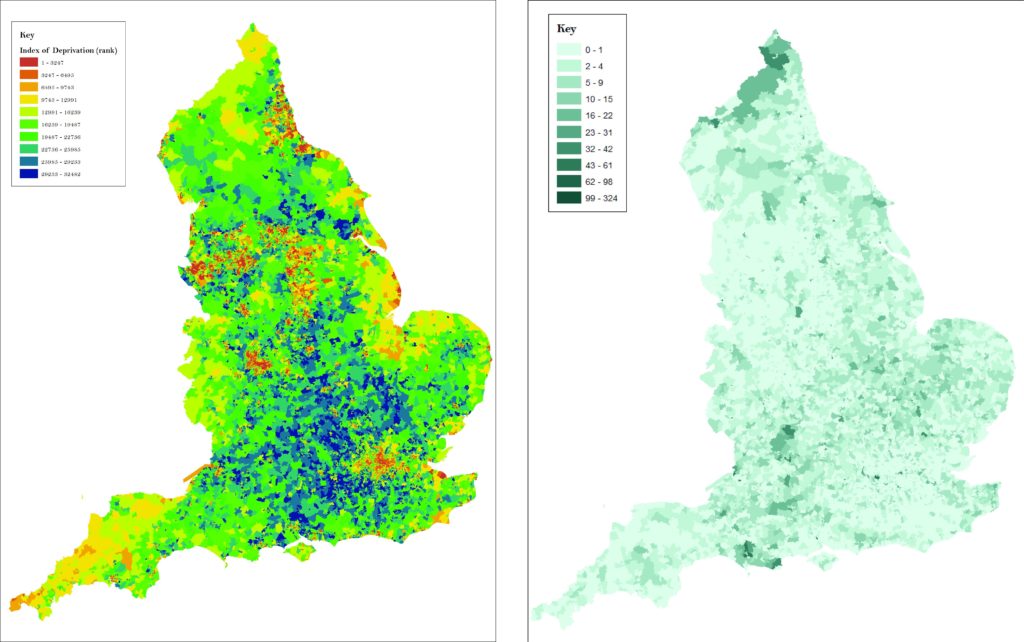
Data Sources i) Indices of Deprivation 2007 for Super Output Areas produced by Department for Communities and Local Government (DCLG), distributed by the Office for National Statistics (ONS) under the National Archives Open Government Licence OGL).; ii) English Heritage Excavation Index.
Figure 8: a) Excavation Index counts for LSOA – top 25%; b) Index of Deprivation for LSOA – bottom 25%; c) Excavation Index counts for LSOA – bottom 25%; Index of Deprivation for LSOA top 25%.
Data Sources i) English Heritage Excavation Index; ii) Indices of Deprivation 2007 for Super Output Areas produced by Department for Communities and Local Government (DCLG), distributed by the Office for National Statistics (ONS) under the National Archives Open Government Licence OGL).
5. Conclusion
From the very basic analyses presented here, it is evident that the history of archaeological excavation in England is a multi-faceted and geographically diverse subject. Put simply, there is no single archaeology of England, but rather there are a series of regional and sub-regional archaeologies influenced by a broad spectrum of socio-economic and political factors When archaeological scholars discuss the archaeology of the country what is actually being reviewed is an experience or instance of archaeology based on fieldwork biases, which are heavily influenced by socio-economic factors. This notion is compounded by the wider social disciplinary framework in which archaeologists work – as has been demonstrated by the evident established history of a ‘southern archaeology’. The data presented here illustrates, that the empirical evidence for archaeology has clearly grown, but grown organically and under the influence of contemporary society and economy. It is undoubtedly a positive, that the gaps, limitations and biases in any perceived knowledge can be identified, and herein is the inherent advantage of freely available digital inventories and databases that by intention or circumstance provide a record of our undertakings. This is of course not to ignore the biases and gaps in these inventories, as well as a realisation that our databases are themselves social constructs. The challenge is to admit this and that although we can synthesise and hypothesise our lists of monuments and finds, to acknowledge and offset the limitations and the possibility of a literal and metaphorical undiscovered country.
- S. Butcher and Paul Garwood. Rescue Excavation 1938 to 1972. A Report for the Backlog Working Party of the Ancient Monuments Advisory Committee of English Heritage. London: English Heritage, 1994. 9.
- Geoffrey Wainwright, ‘Time Please’, Antiquity 74, 2000. 909-943; Timothy Darvill and Bronwen Russell, Archaeology after PPG16: Archaeological Investigations in England 1990-1999. Bournemouth: Bournemouth University School of Conservation Sciences Research Report 1, 2002. 53-55; Paul Everill, The Invisible Diggers. A study of commercial archaeology. Oxford: Oxbow. Heritage Research Series 1, 2009;Southport Group, Realising the benefits of planning-led investigation in the Historic Environment: A framework for delivery. Reading: IFA, 2011.
- See Sian Jones, Ann MacSween, Stuart Jeffrey, Richard Morris and Mike Heyworth, From the Ground Up. The publication of archaeological projects: a user needs survey. York: Council for British Archaeology, 2001.
- Keith Kintigh, ‘The Promise and Challenge of Archaeological Data Integration’, American Antiquity 71-3, 2006. 567-578.
- Birger Hjørland, ‘What is Knowledge Organization (KO)?’, Knowledge Organization. International Journal devoted to Concept Theory, Classification, Indexing and Knowledge Representation 35(2/3) (2008). 86-101.
- Edmund Lee, ‘Everything We Know Informs Everything We Do’: A Vision for Historic Environment Sector Knowledge and Information Management’, The Historic Environment 3-1 (2012) 28-41 (29).
- See Steve Roskams. Excavation. Cambridge: Cambridge University Press, 2001. 24.
- Christopher Evans, ‘Archaeology and Modern Times’, Antiquity 63 (1989). 436-450; Mike Parker-Pearson, ‘The beginning of wisdom’, Antiquity 72 (1998). 680-686.
- Polly J. Fahnestock, ‘History and Theoretical Development: The importance of a critical Historiography of Archaeology’, Archaeological Review from Cambridge 3-1 (1984). 7-18 (13); Christopher Tilley, ‘Archaeology: the loss of isolation’, Antiquity 72 (1998). 691-693 (693).
- Darvill and Russell, 11.
- Catherine Hardman and Julian D. Richards, ‘OASIS: Dealing with the Digital Revolution’. Ed. M. Doerr and A. Sarris. The Digital Heritage of Archaeology: Computer Applications and Quantitative Methods in Archaeology. Archive of Monuments and Publications: Hellenic Ministry of Culture, 2003. 325-9.
- William K. Michener, James W. Brunt, John J. Helly, Thomas, B. Kirchener and Susan G. Stafford, ‘Nongeospatial metadata for the ecological sciences’, Ecological Applications 7(1) (1997). 330-342.
- http://archaeologydataservice.ac.uk/archsearch/ (Accessed 01/02/2010).
- http://www.oasis.ac.uk/england/, http://archaeologydataservice.ac.uk/archives/view/greylit/ (Accessed 01/09/2012).
- http://dx.doi.org/10.5284/1017767 (Accessed 01/09/2012).
- http://dx.doi.org/10.5284/1000158 (Accessed 01/09/2012).
- http://www.english-heritage.org.uk/professional/protection/process/spatial-data/ (Accessed 01/04/2011).
- www.ordnancesurvey.co.uk/oswebsite/opendata/docs/os-opendata-licence.pdf (Accessed 01/09/2012).
- http://www.nationalarchives.gov.uk/doc/open-government-licence/ (Accessed 01/09/2012).
- http://data.gov.uk/dataset/index_of_multiple_deprivation_imd_2007 (Accessed 01/09/2012)
- For the purposes of this paper “investigation” “event” or ”excavation” is used to denote either an excavation or evaluation, as defined in the English Heritage Event Types Thesaurus: http://thesaurus.english-heritage.org.uk/thesaurus.asp?thes_no=566&thes_name=EH%20Event%20Types%20Thesaurus (Accessed 01/04/2013)
- For example, see Peter J. Fowler, Approaches to Archaeology. London: A and C Black Ltd, 1977.
- Definition: “A limited programme of intrusive fieldwork which determines the presence or absence of archaeological features, structures, deposits, artefacts or ecofacts within a specified area or site on land or within the inter-tidal zone.” http://thesaurus.english-heritage.org.uk/thesaurus.asp?thes_no=566&thes_name=EH%20Event%20Types%20Thesaurus (Accessed 01/04/2013)
- Definition: “Controlled intrusive fieldwork which examines, records and interprets archaeological deposits, features and structures and, as appropriate, retrieves artefacts and ecofact remains within a specified area or site on land or within the inter-tidal zone.” http://thesaurus.english-heritage.org.uk/thesaurus.asp?thes_no=566&thes_name=EH%20Event%20Types%20Thesaurus (Accessed 01/04/2013)
- For further information on PPG16 see Department of the Environment, Planning Policy Guidance: Archaeology and Planning PPG16. London: Department of the Environment, 1990.
- For example, see David T. Yates. Land, Power and Prestige: Bronze Age Field Systems in Southern England. Oxford: Oxbow Books, 2006. 108.
- Darvill and Russell, 11.
- Jon Bateman and Stuart Jeffrey, ‘What Matters about the Monument: reconstructing historical classification’, Internet Archaeology, 2011. 29. http://dx.doi.org/10.11141/ia.29.6 (Accessed 01/05/2013).
- Tim N.L. Evans, ‘Holes in the Archaeological Record? A Comparison of National Event Databases for the Historic Environment in England’, The Historic Environment 4-1, 2013. 34–49.
- Martin Newman, ‘On the Record: The Philosophy of Recording. An Introduction’, Internet Archaeology 29. 2011. http://dx.doi.org/10.11141/ia.29.5 (Accessed 01/05/2013).
- Tim N.L. Evans. 48.
- Butcher and Garwood. 9; Everill. 25.
- Butcher and Garwood ibid.
- Christopher Evans 1989. 440.
- V. Gordon Childe, ‘Changing methods and aims in prehistory: Presidential address for 1935’, Proceedings of the Prehistoric Society 1, 1935. 1-15.
- Editorial’, Medieval Archaeology 1, 1957. 1-3.
- Nathan Schalnger and Jarl Nordblach. Archives, Ancestors, Practices. Archaeology in the light of its history. Oxford:Berghahn Books, 2007.
- (Bateman and Jeffrey)
- Stuart Piggott. ‘Review’, Proceedings of the Prehistoric Society 12, 1946. 176-177; Christopher Evans. ‘Historicism, chronology and straw men: situating Hawkes’ Ladder of Inference’, Antiquity 72, 2008. 398-404.
- Tim Murray. ‘Epilogue: why the history of archaeology matters’, Antiquity 76, 2002. 244-8 (236).
- (Bateman & Jeffrey)
- Darvill and Russell. 53
- Richard Bradley. ‘Bridging the Two Cultures – commercial archaeology and the study of Prehistoric Britain’ The Antiquaries Journal 86, 2006. 1-13; Neil Holbrook and Richard Morton. Assessing the Research Potential of Grey Literature in the study of Roman England. Stage 1 report. Cirencester: Cotswold Archaeology, 2008. http://dx.doi.org/10.5284/1000368 (Accessed 01/11/2012).
- http://oasis.ac.uk/monitoring/second_report.cfm (Accessed 01/05/2013).
- Adrian Smith, Sarah Cairns and Clare Vokes, Review of the development and implementation of OASIS in England, Pye-Tait Consulting. http://oasis.ac.uk/downloads/OASIS-Review-Final-Report-270112-v2.pdf”/] (Accessed 01/06/2012).
- Ben Robinson. ‘English Sites and Monuments Records – Information, Communication and Technology’. Ed. Gary Lock and K. Brown. On the Theory and Practice of Archaeological Computing. Oxford: Oxbow Books, Oxford University Committee for Archaeology Monograph 1, 2000. 89-106 (99); Tim N.L Evans and Catherine Hardman. GLADE: Grey Literature – Access Dissemination and Enhancement. The Pilot Assessment Phase Final Report. York: Archaeology Data Service, 2010. http://archaeologydataservice.ac.uk/research (Accessed 01/12/2010).
- English Heritage Excavation Index figures: all records where type = ‘Evaluation’ or ‘Excavation’ (Accessed 01/09/2012); Grey Literature Library and OASIS figures: all records where investigation type or method of investiagtion = ‘Full excavation’, ‘Open-area excavation’, ‘Part Excavation’, ‘Salvage Excavation’, ‘Salvage Record’, ‘Sample Trenches’, ‘Targeted Trenches’, or ‘Test Pits’ (Accessed 01/09/2012).
- For example: http://www.arch.ox.ac.uk/englishlandscapes-introduction.html; Michael Fulford and Neil Holbrook. ‘Assessing the contribution of commercial archaeology to the study of the Roman period in England’. The Antiquaries Journal 91, 2011. 323-345.
- Alasdair Whittle, Frances Healy and Alex Bayliss. Gathering Time: Dating the Early Neolithic Enclosures of Southern Britain and Ireland. Oxford: Oxbow Books, 2012.
- (Everill)
- http://rescue-archaeology.org.uk/ (Accessed 01/09/2012).
- http://rescue-archaeology.org.uk/2011/09/23/concerns-for-archaeological-in-sandwell-west-midlands/ (Accessed 01/05/2013).
- Kenneth Aitchison, ‘United Kingdom archaeology in economic crisis’. Ed. Nathan Schlanger, and Kenneth Aitchison, K. Archaeology and the Global Economic Crisis. Multiple Impacts, Possible Solutions. [link url=http://dx.doi.org/10.5284/1000407/] (Accessed 01/09/2012).
- Alain Schnapp. The Discovery of the Past: The Origins of Archaeology. London: British Museum Press, English edition and translation, 1996. 13; Murray.
- For full definition, see: http://www.ons.gov.uk/ons/guide-method/geography/beginner-s-guide/census/super-output-areas–soas-/index.html (Accessed 01/05/2013).